
BETA We are introducing Dashboards to Requirement Yogi. You can already start working with it as it is live !
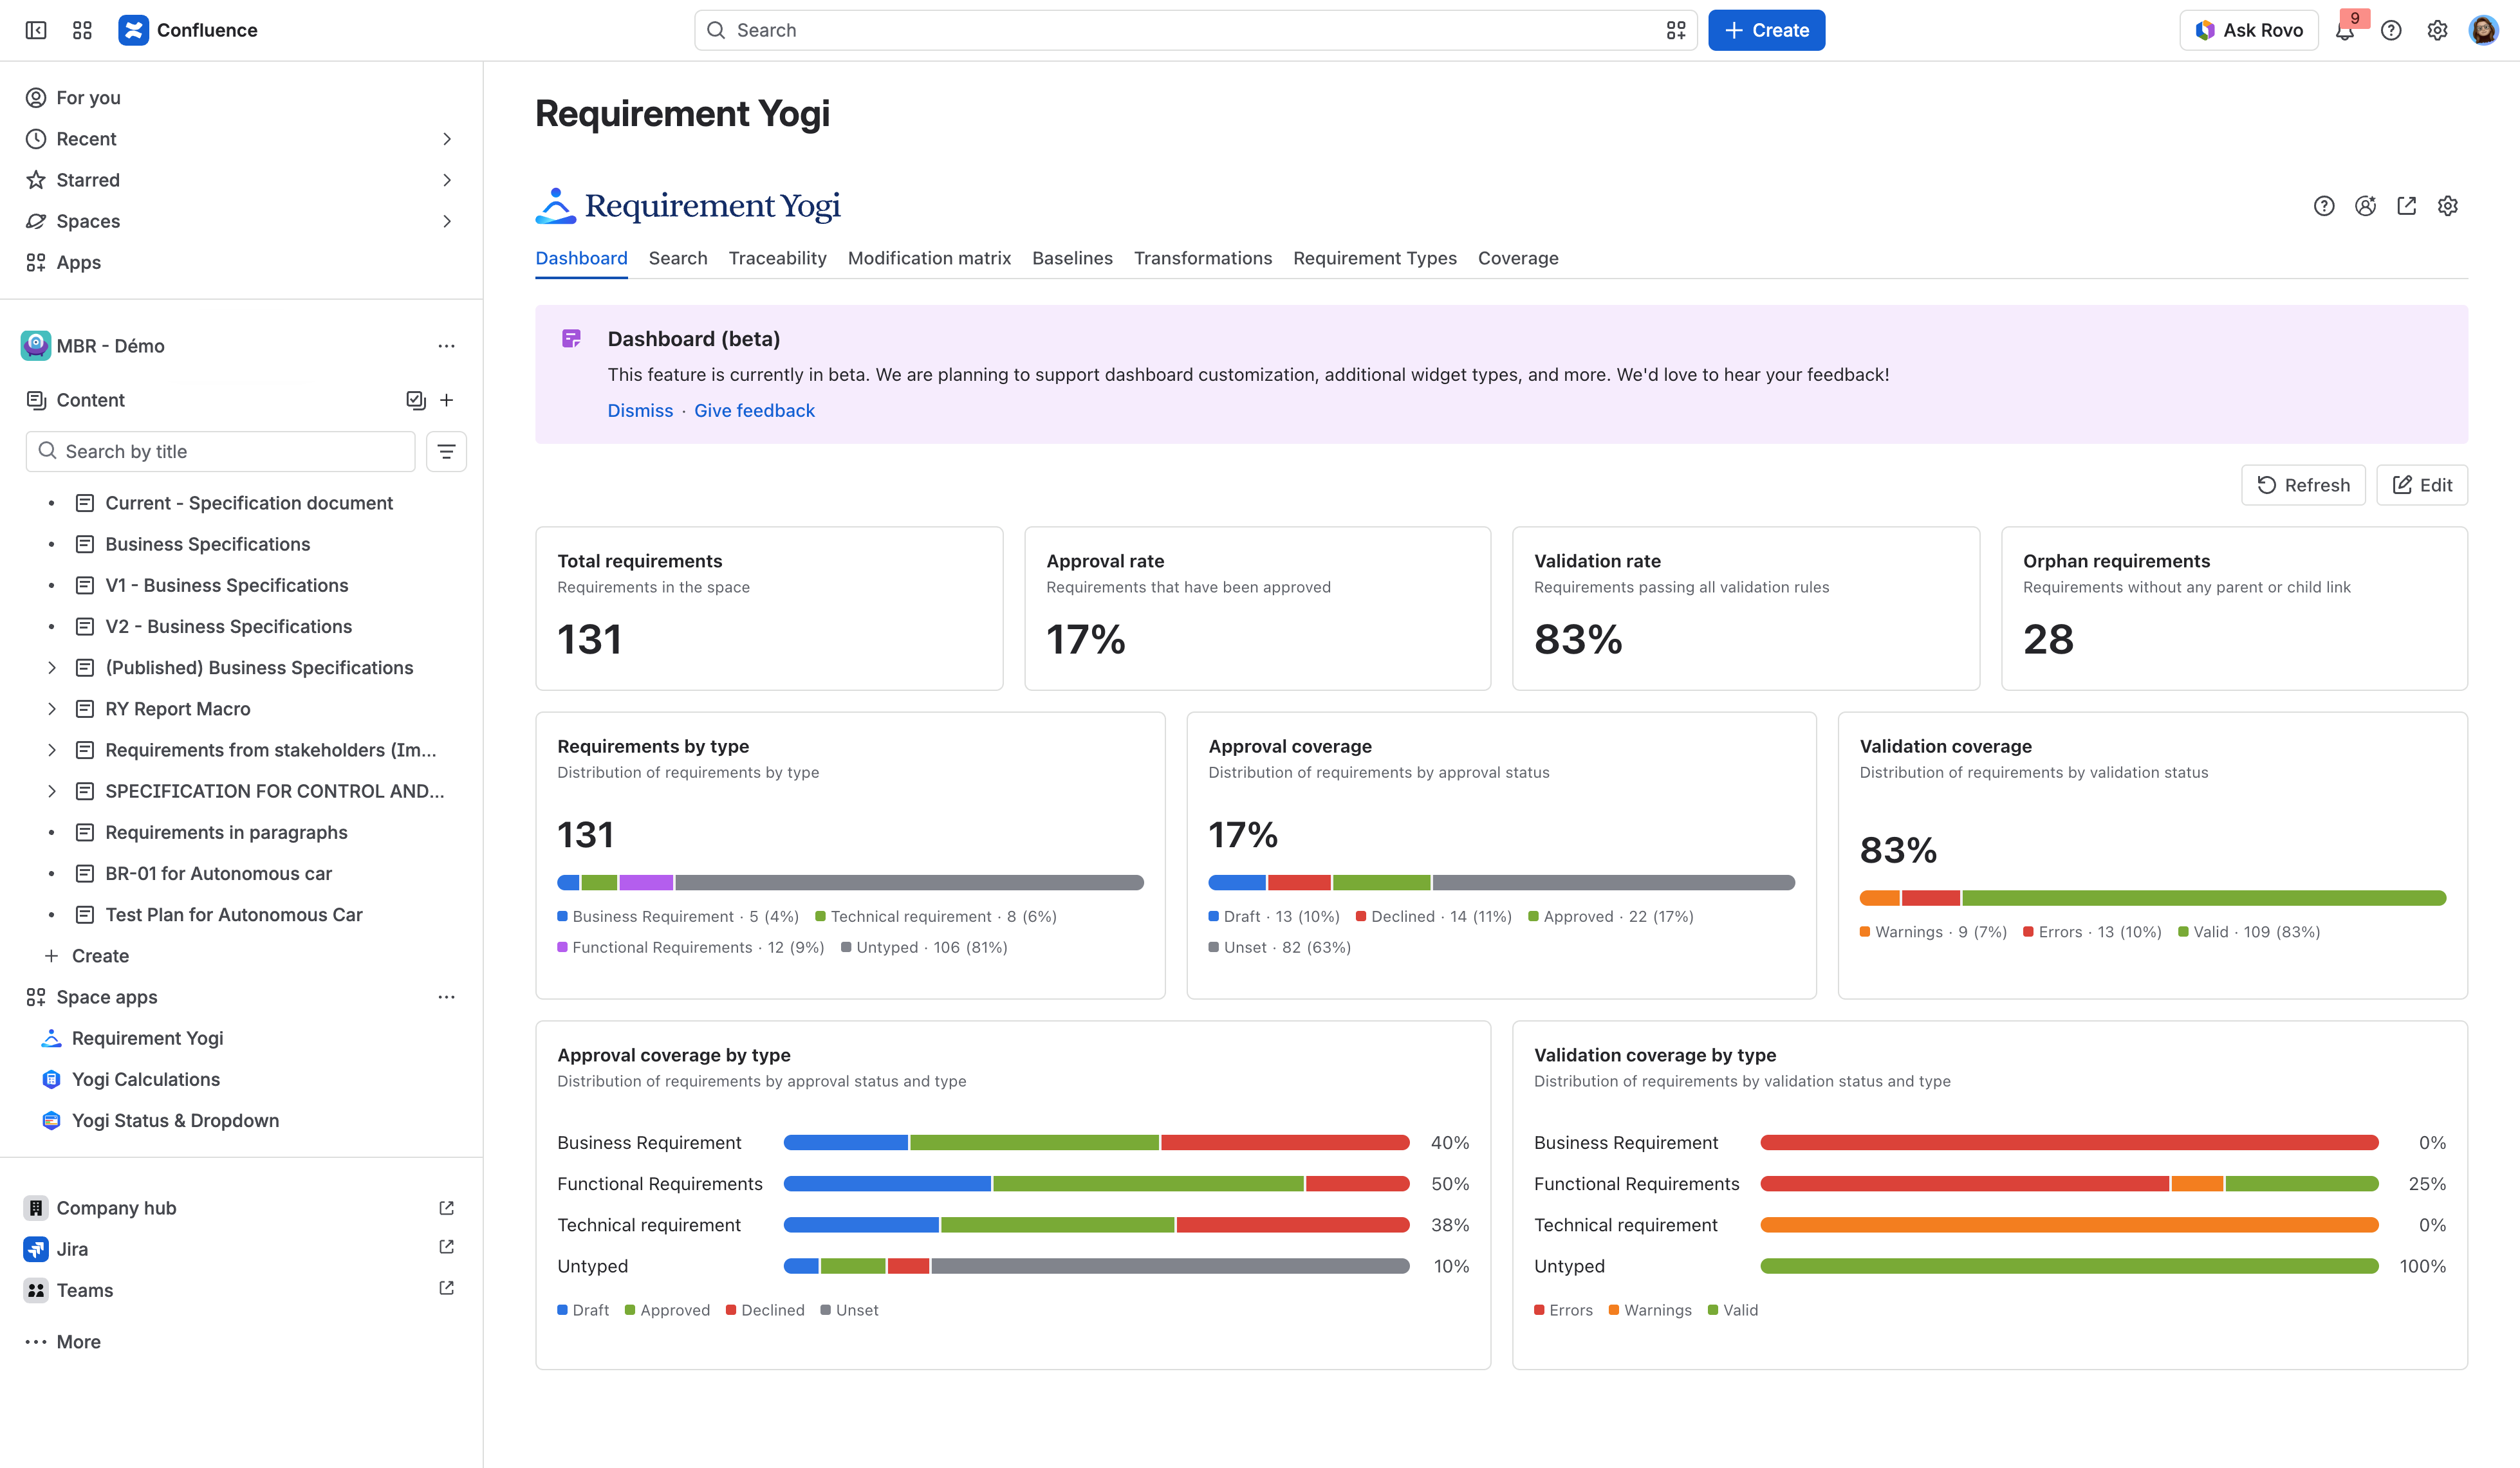
Dashboards are configurable pages that display visual summaries of your requirements:
-
Visualise requirement coverage, status, and progress at a glance.
-
Share project health updates with stakeholders and delivery teams.
-
Track open items, validation progress, and requirement changes more easily.
-
Reduce manual reporting effort by keeping information connected to live requirement data.
Use cases
-
You are looking to extract visual information from your requirements.
-
Prepare a project status review before a steering committee or sprint review.
-
Monitor requirement readiness before development, testing, or release milestones.
-
Highlight incomplete, unvalidated, or at-risk requirements.
-
Create a shared reporting view for product owners, analysts, QA teams, and stakeholders.
Getting started
-
Open Requirement Yogi from your Confluence space.
-
Go to the Dashboards tab.
-
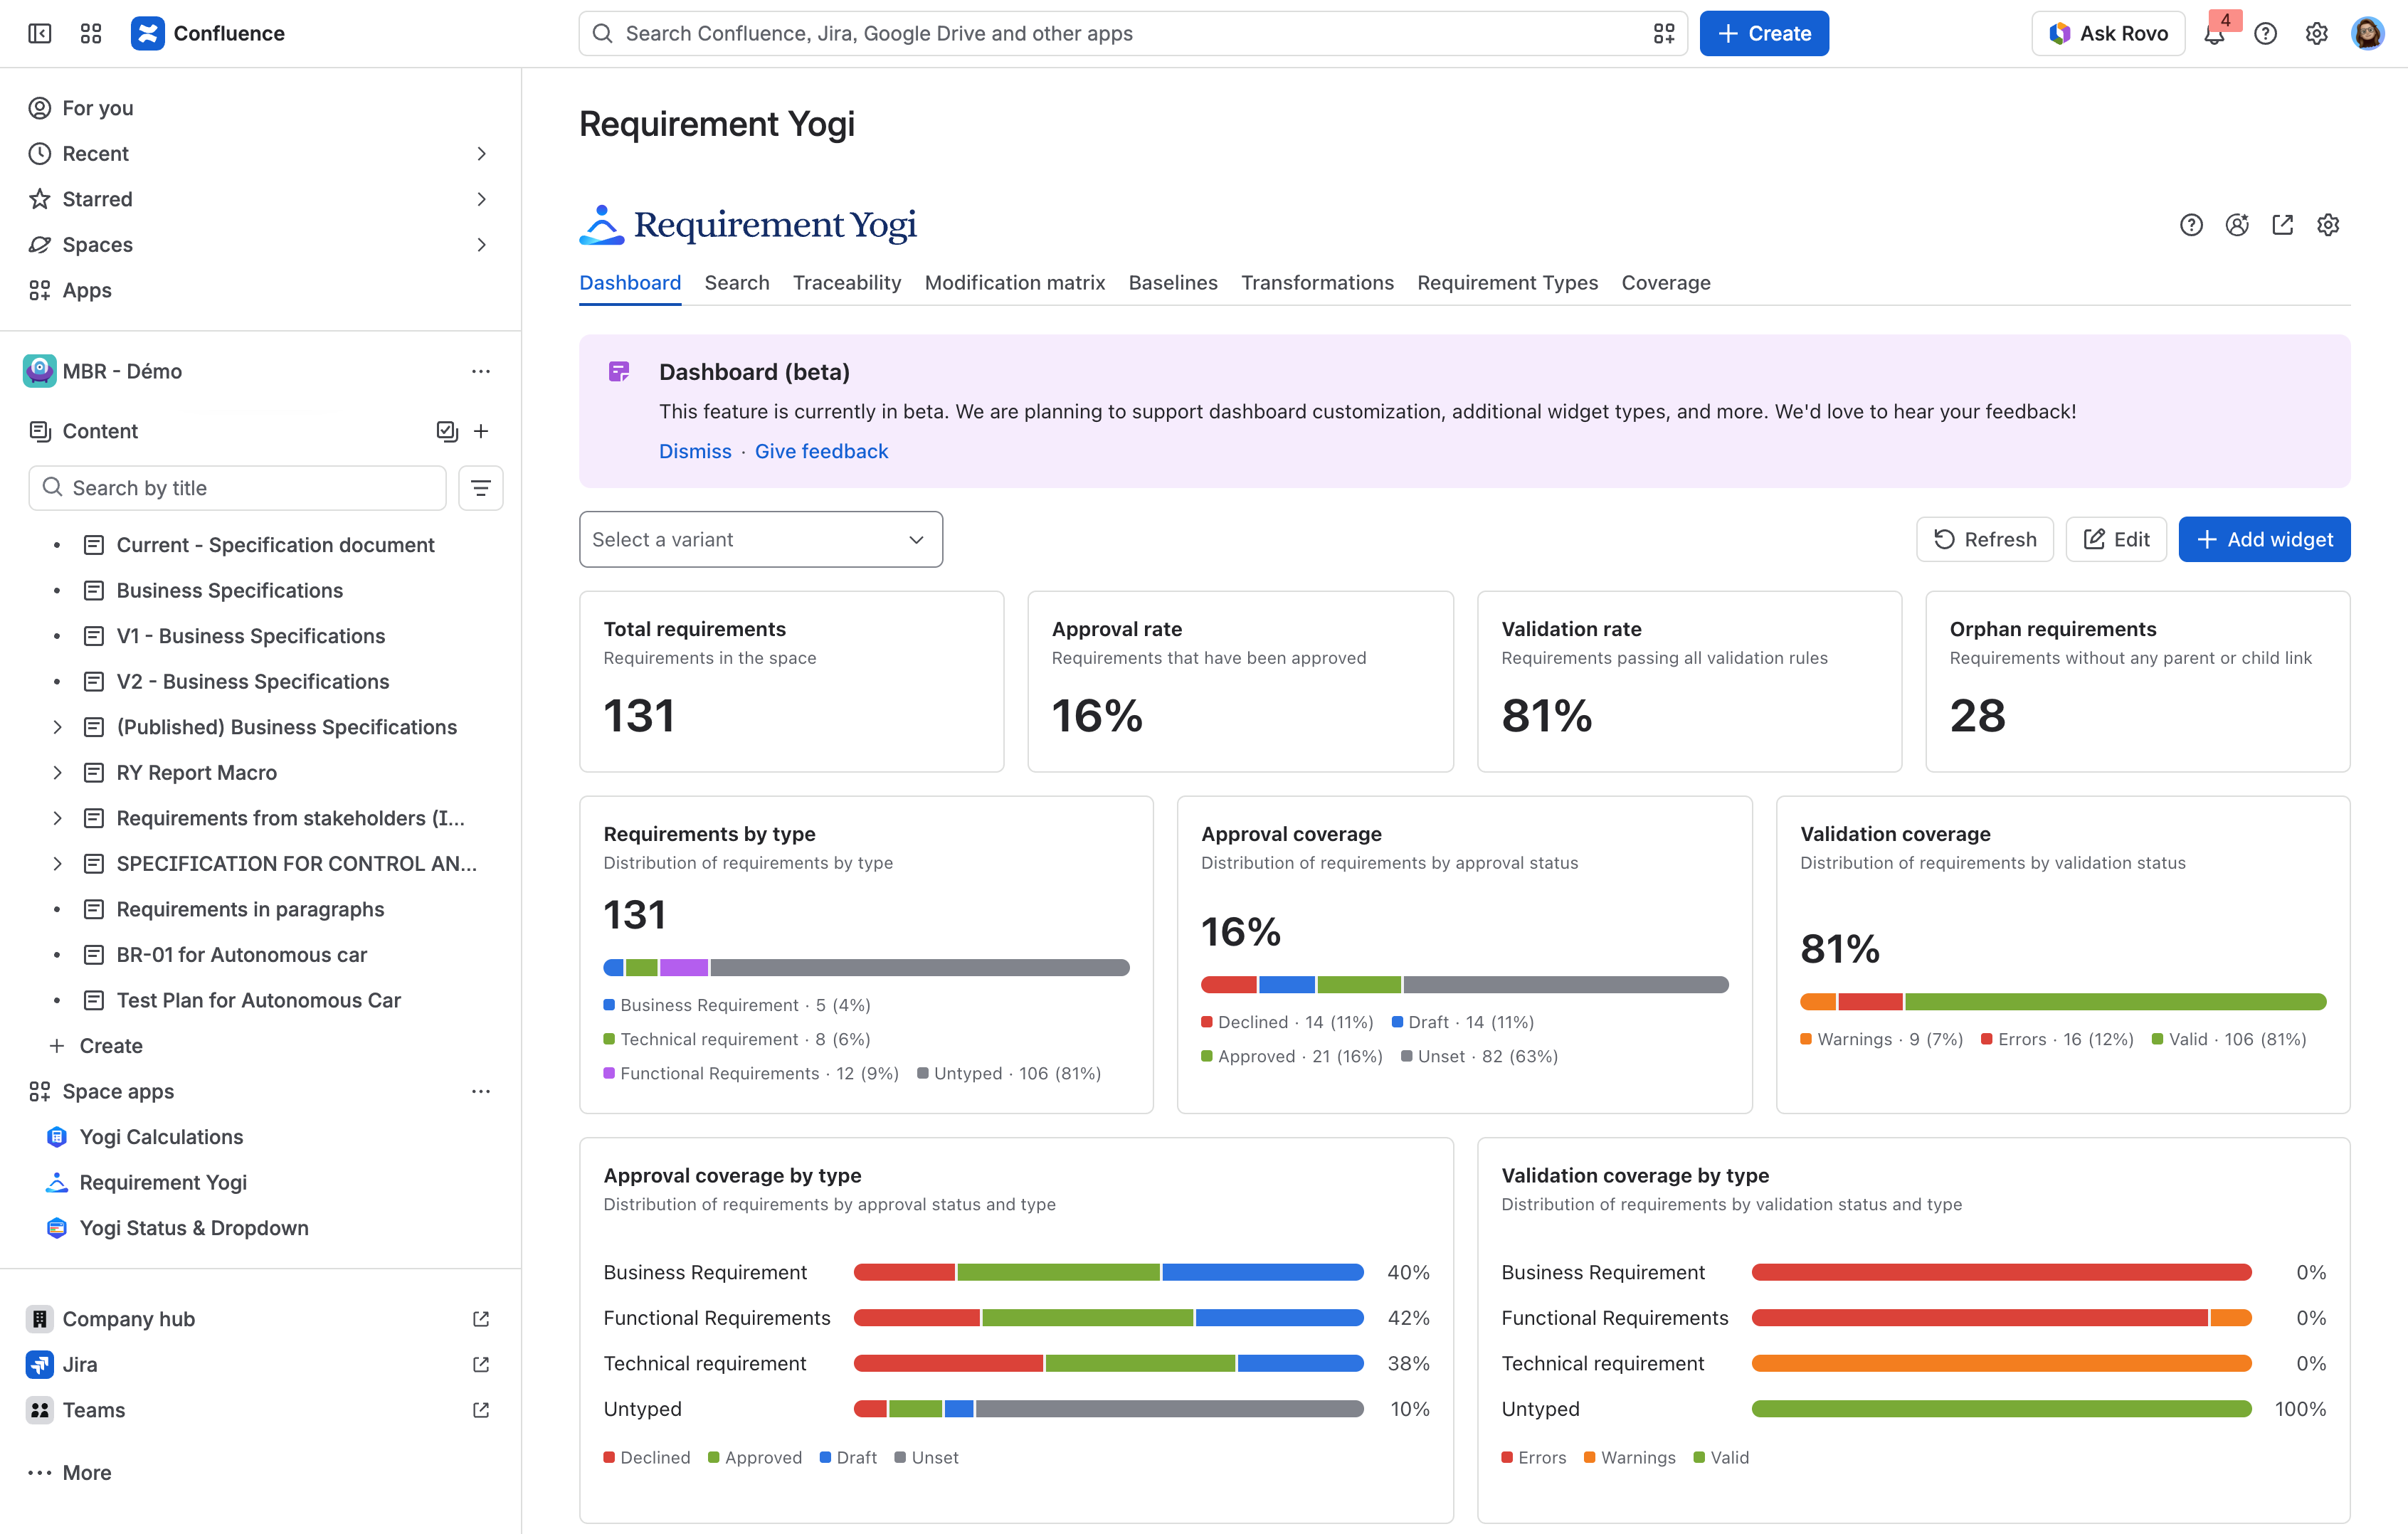
View the default dashboard.
How to edit the dashboards
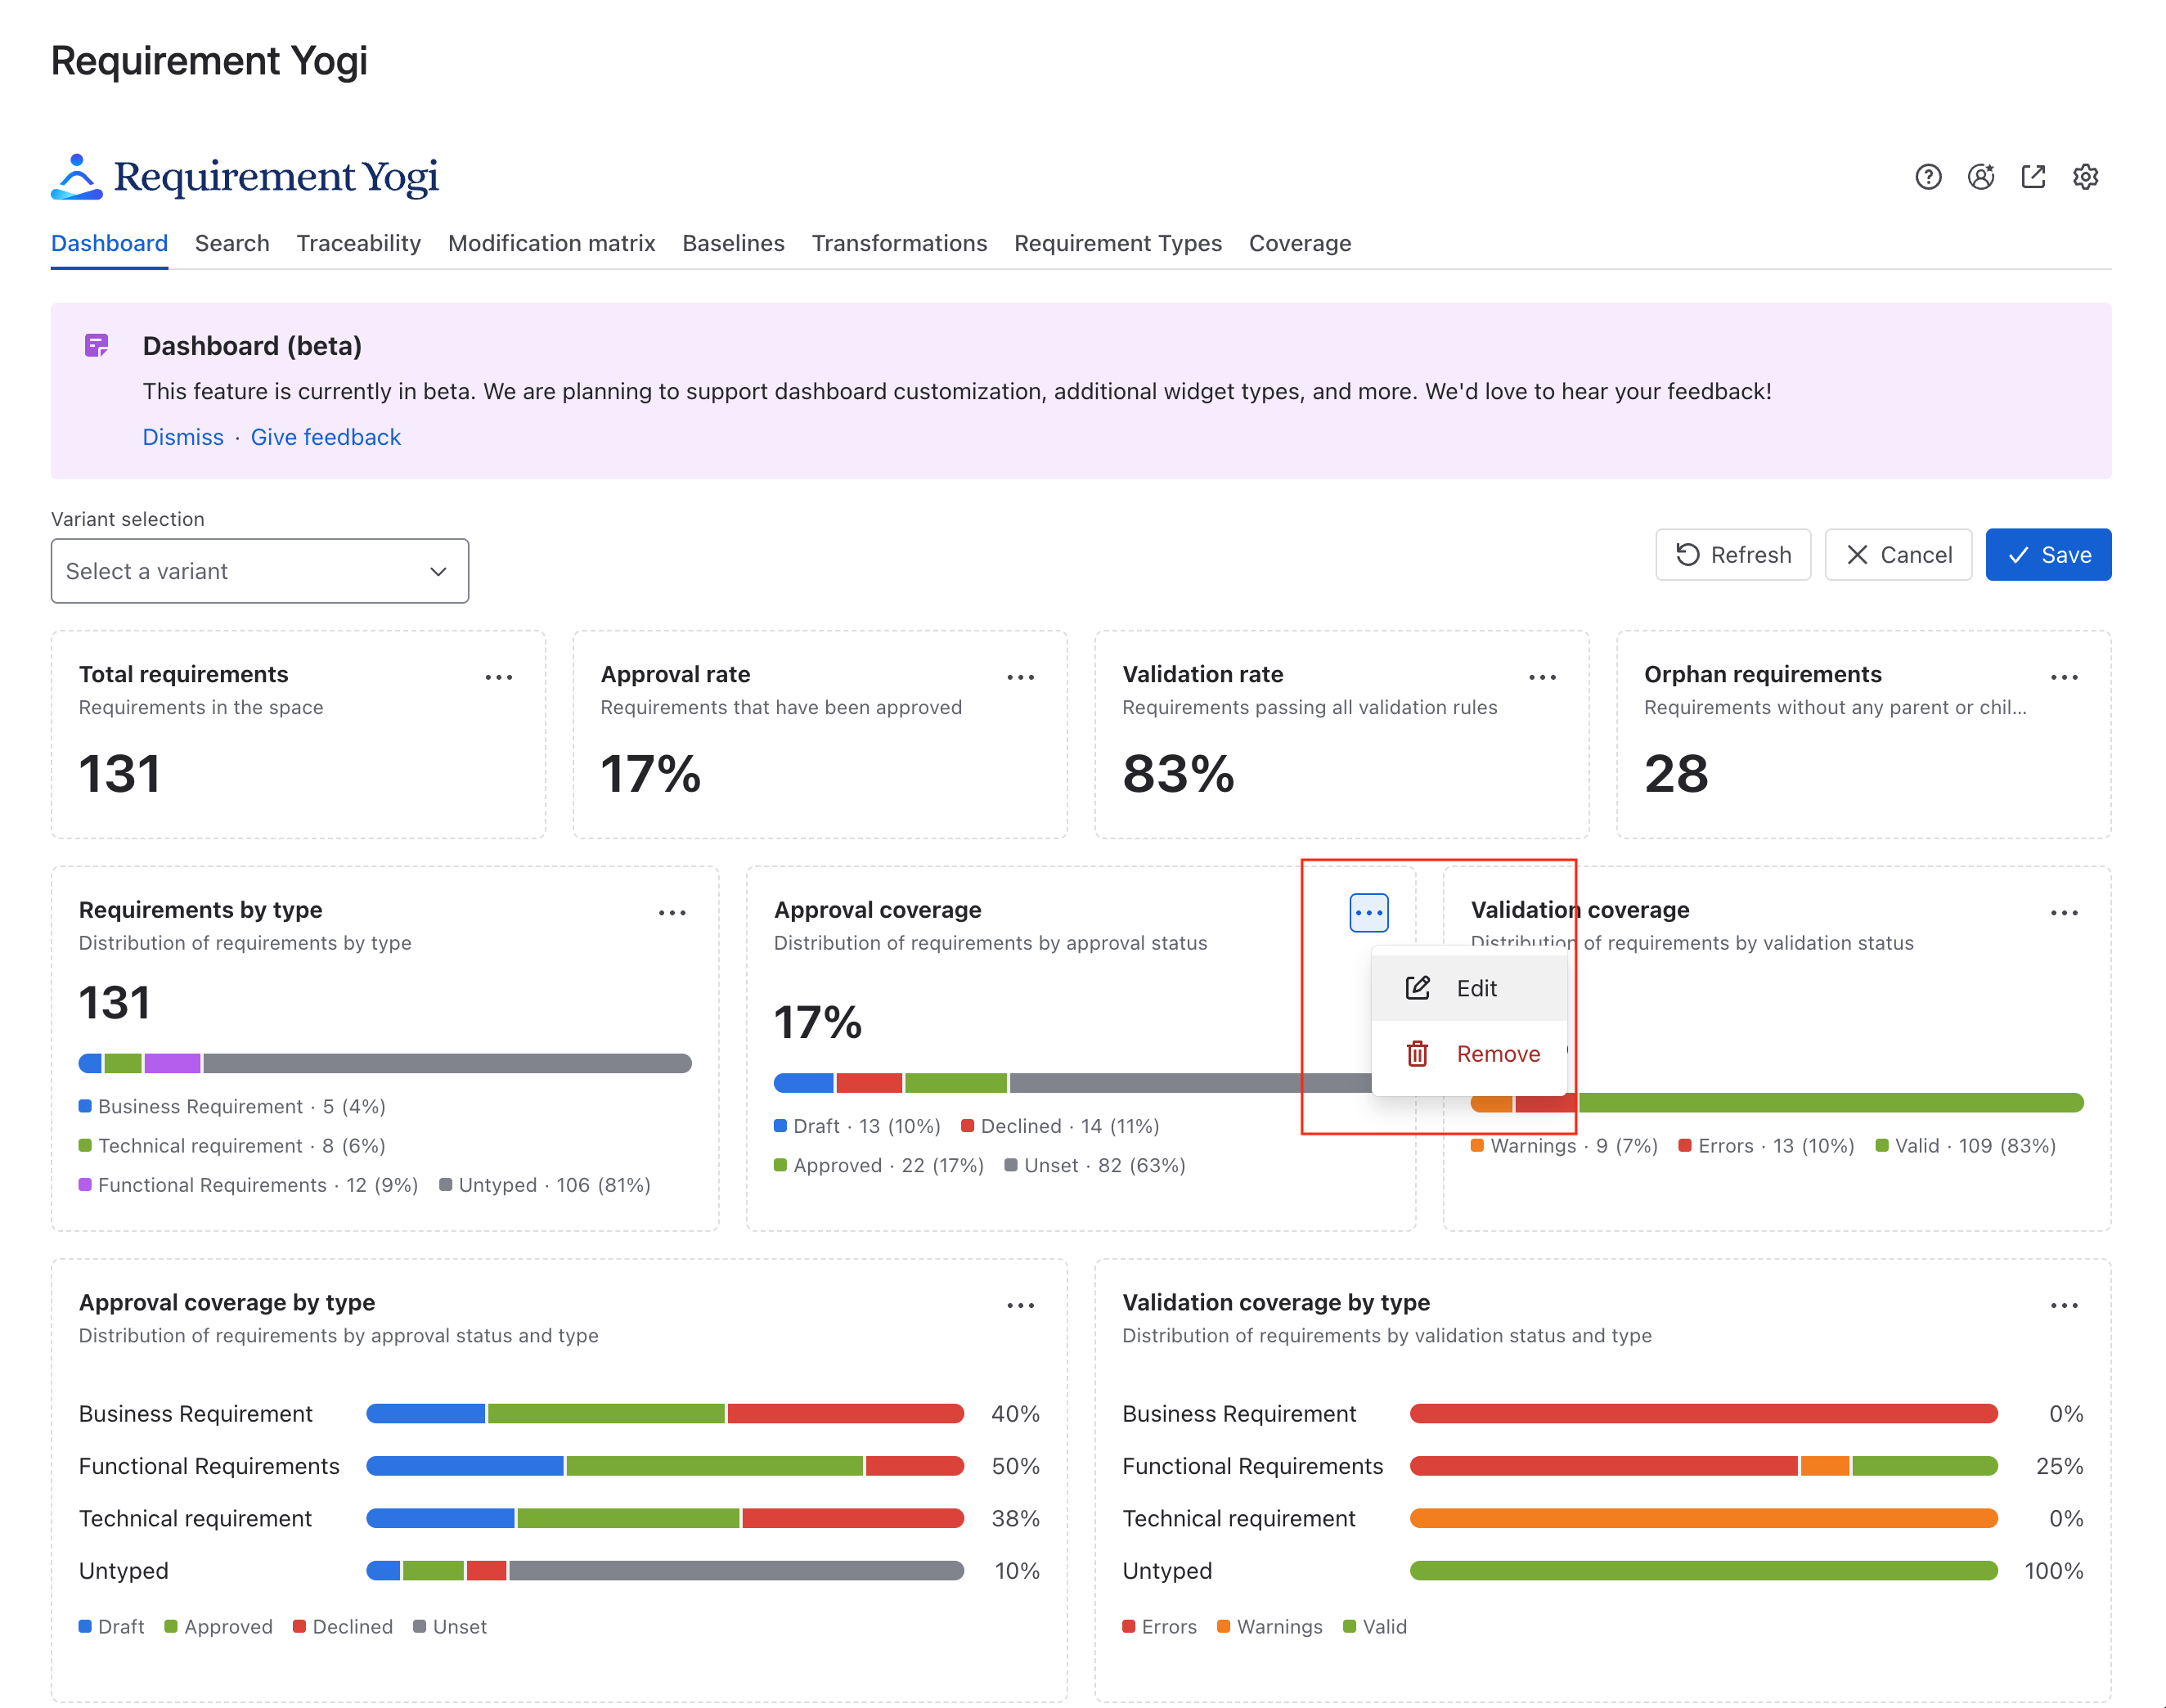
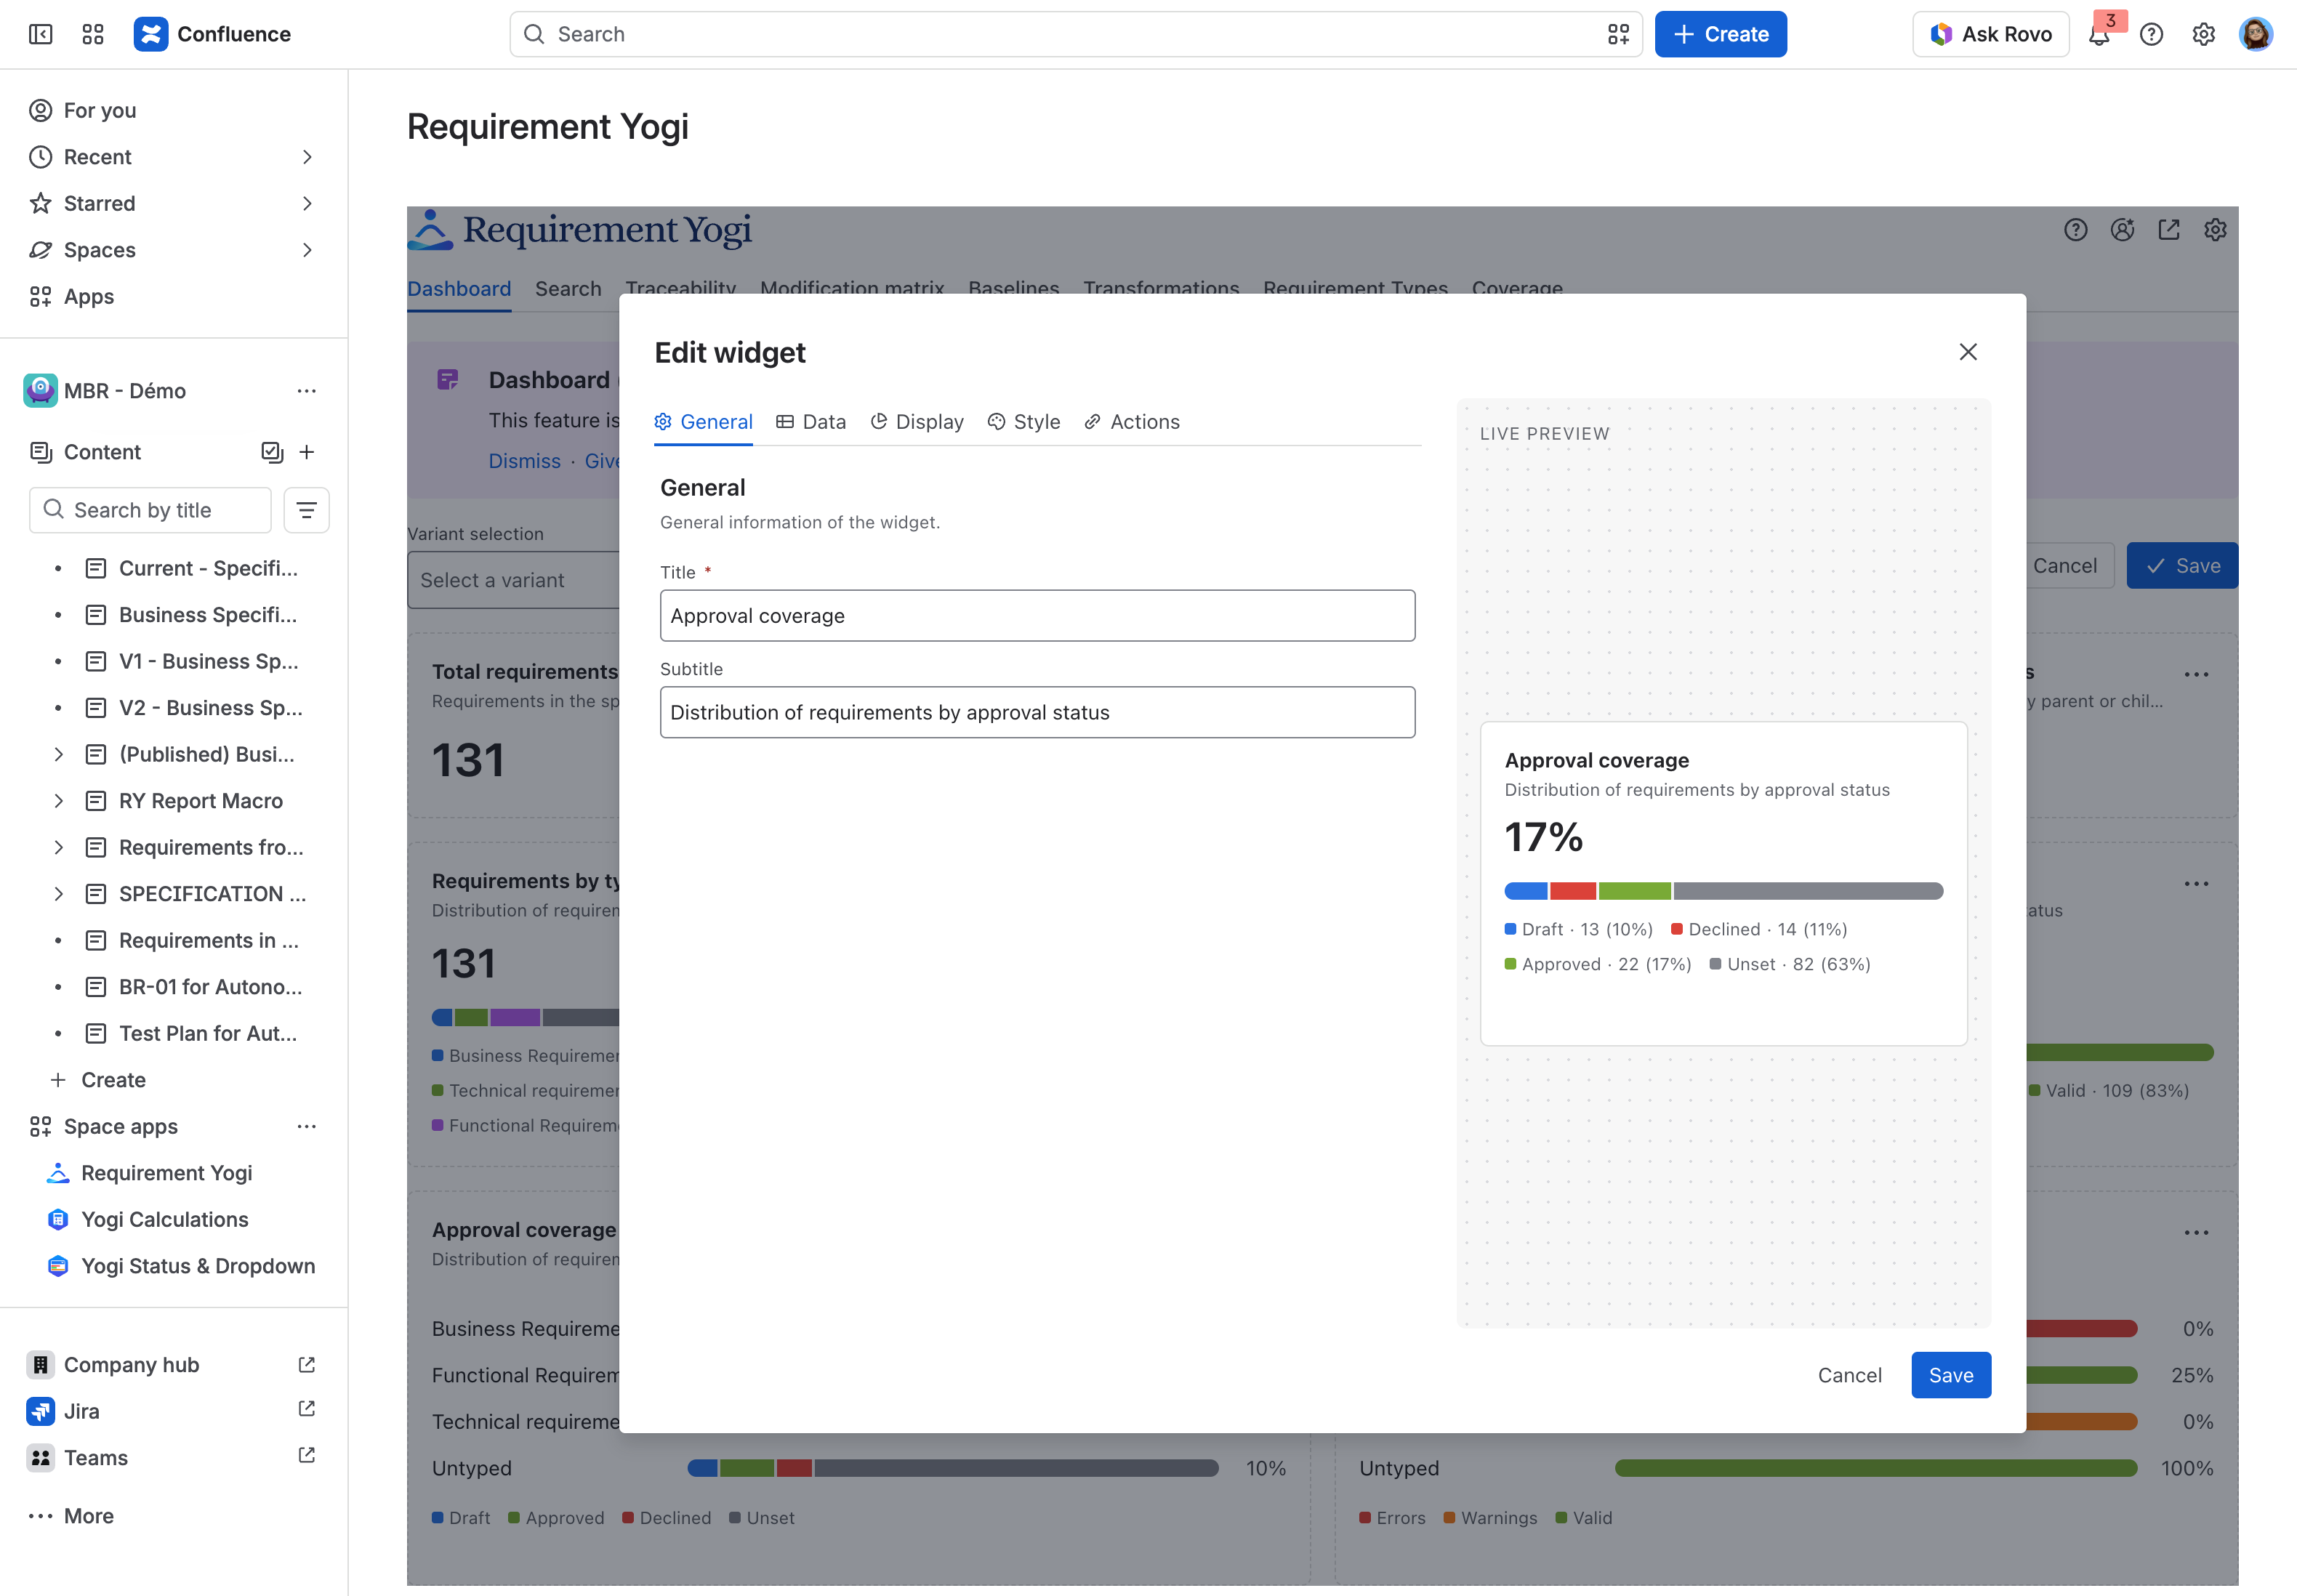
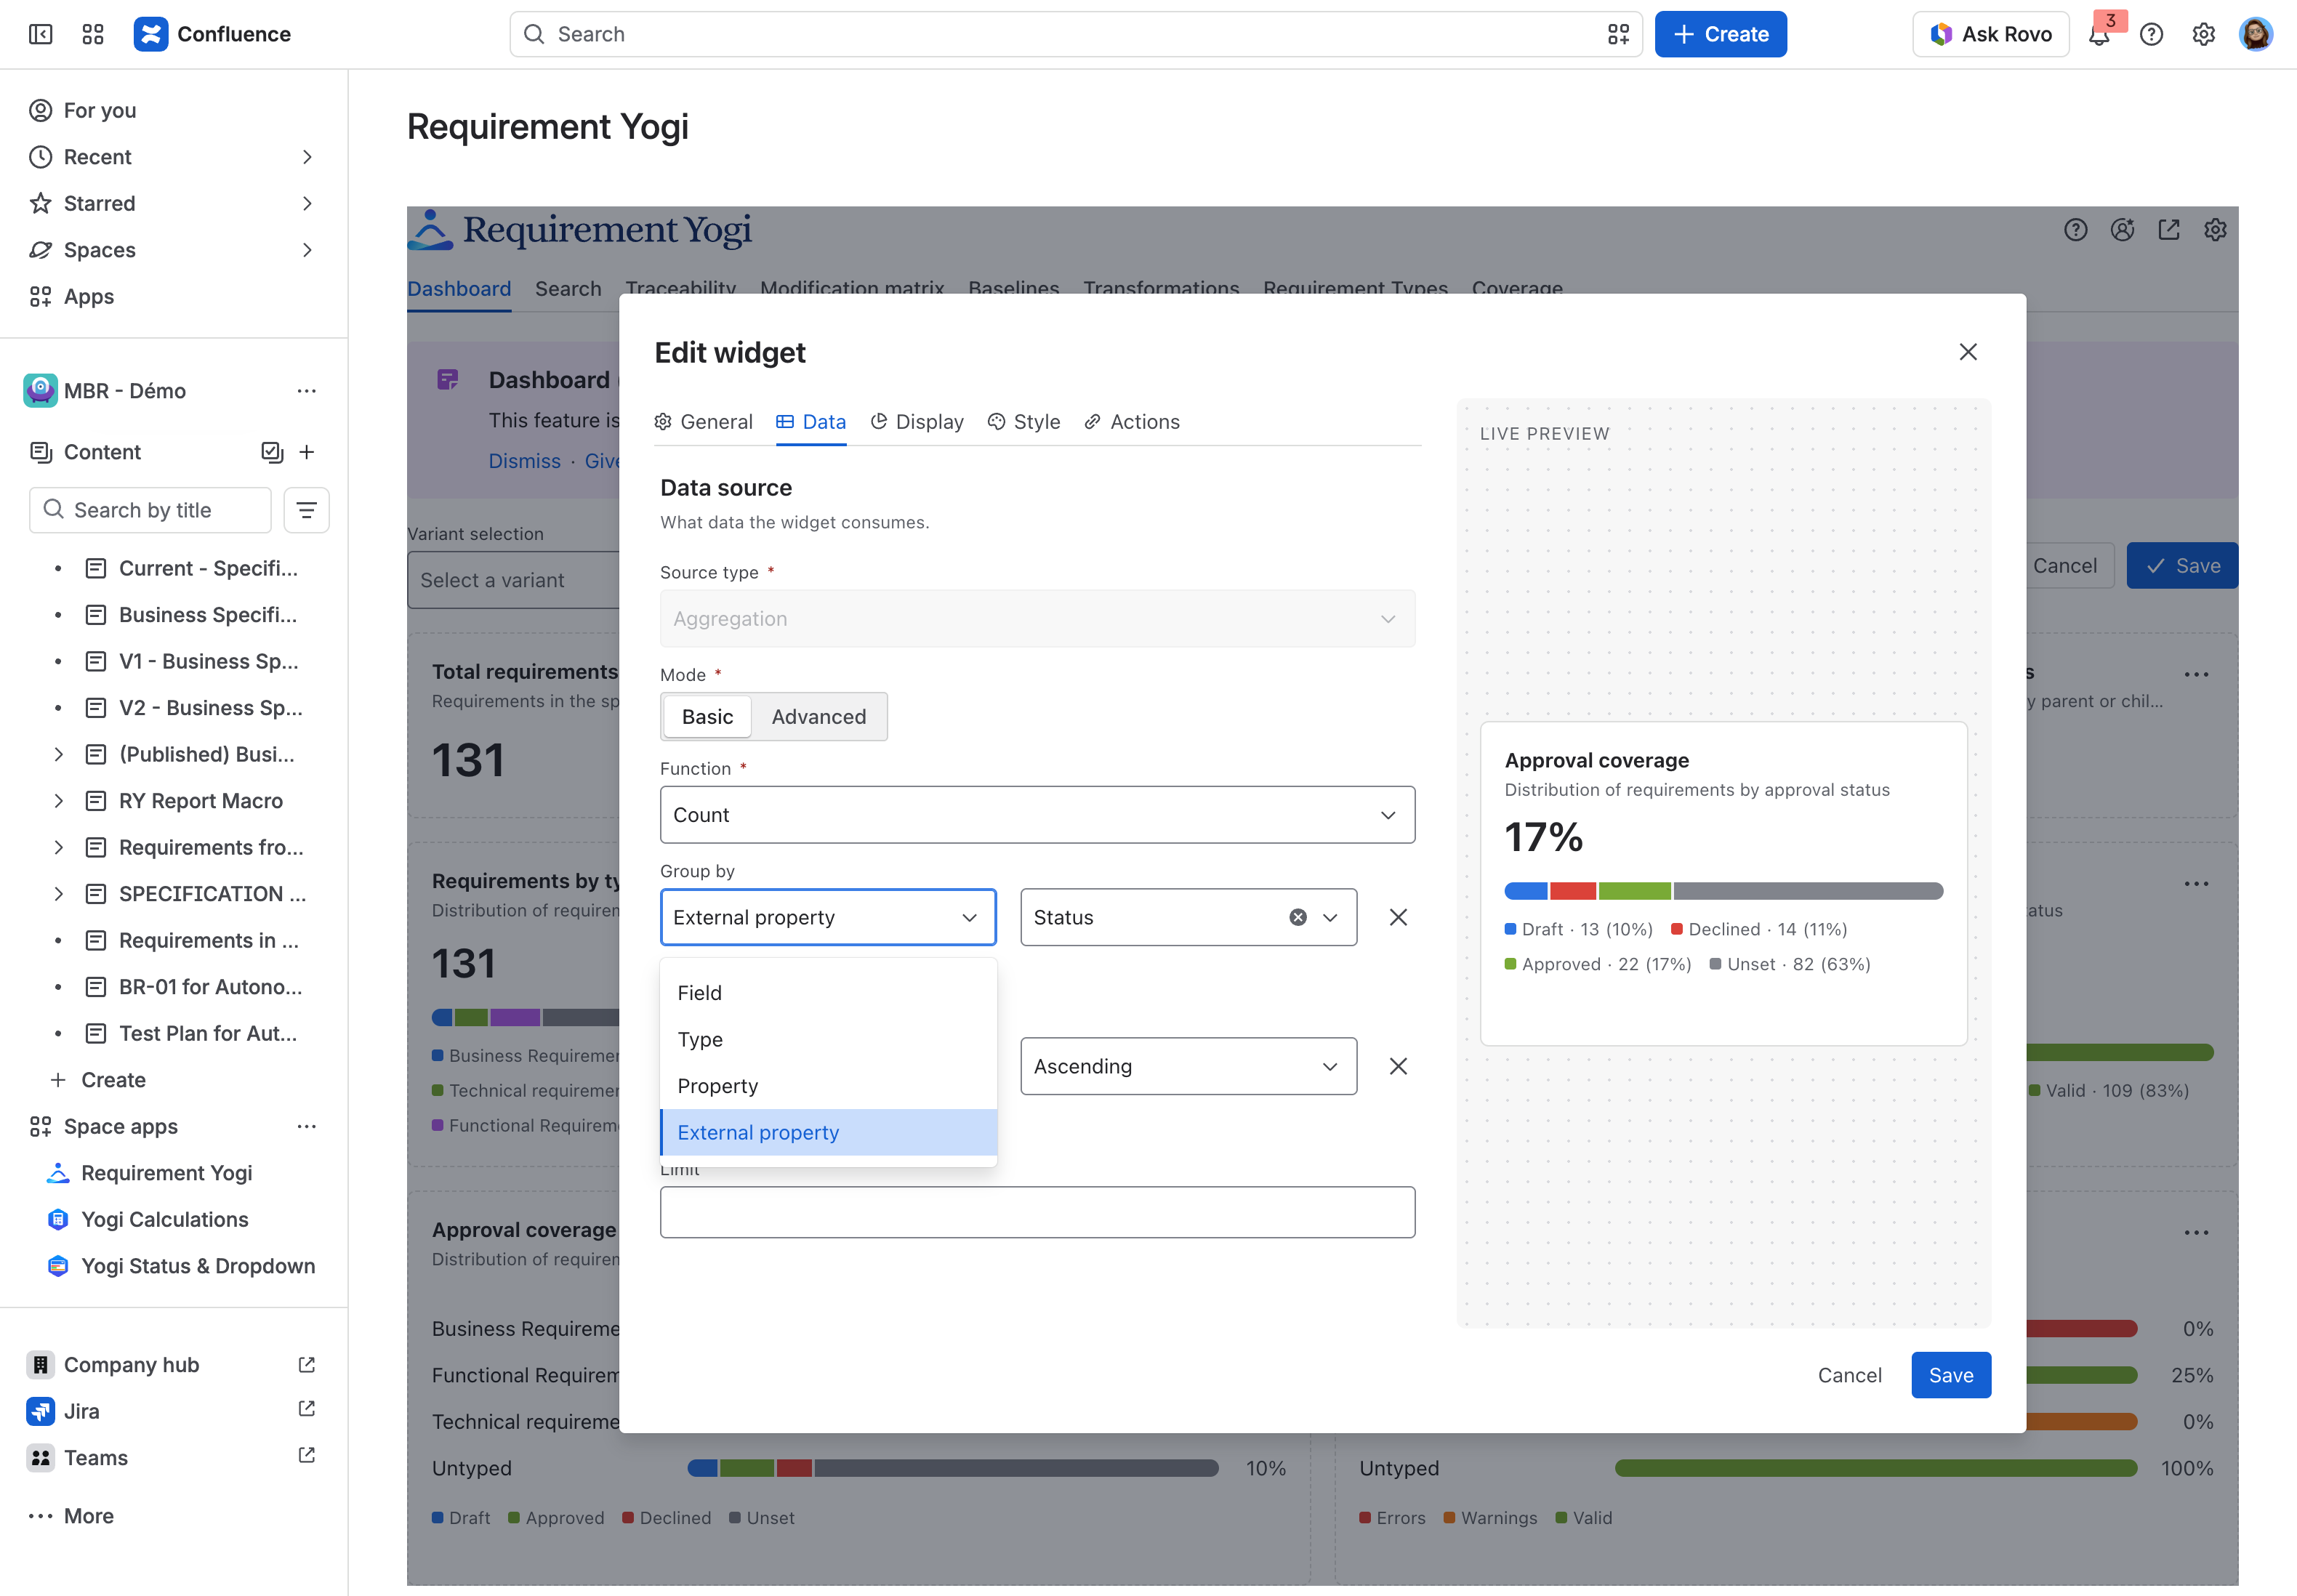
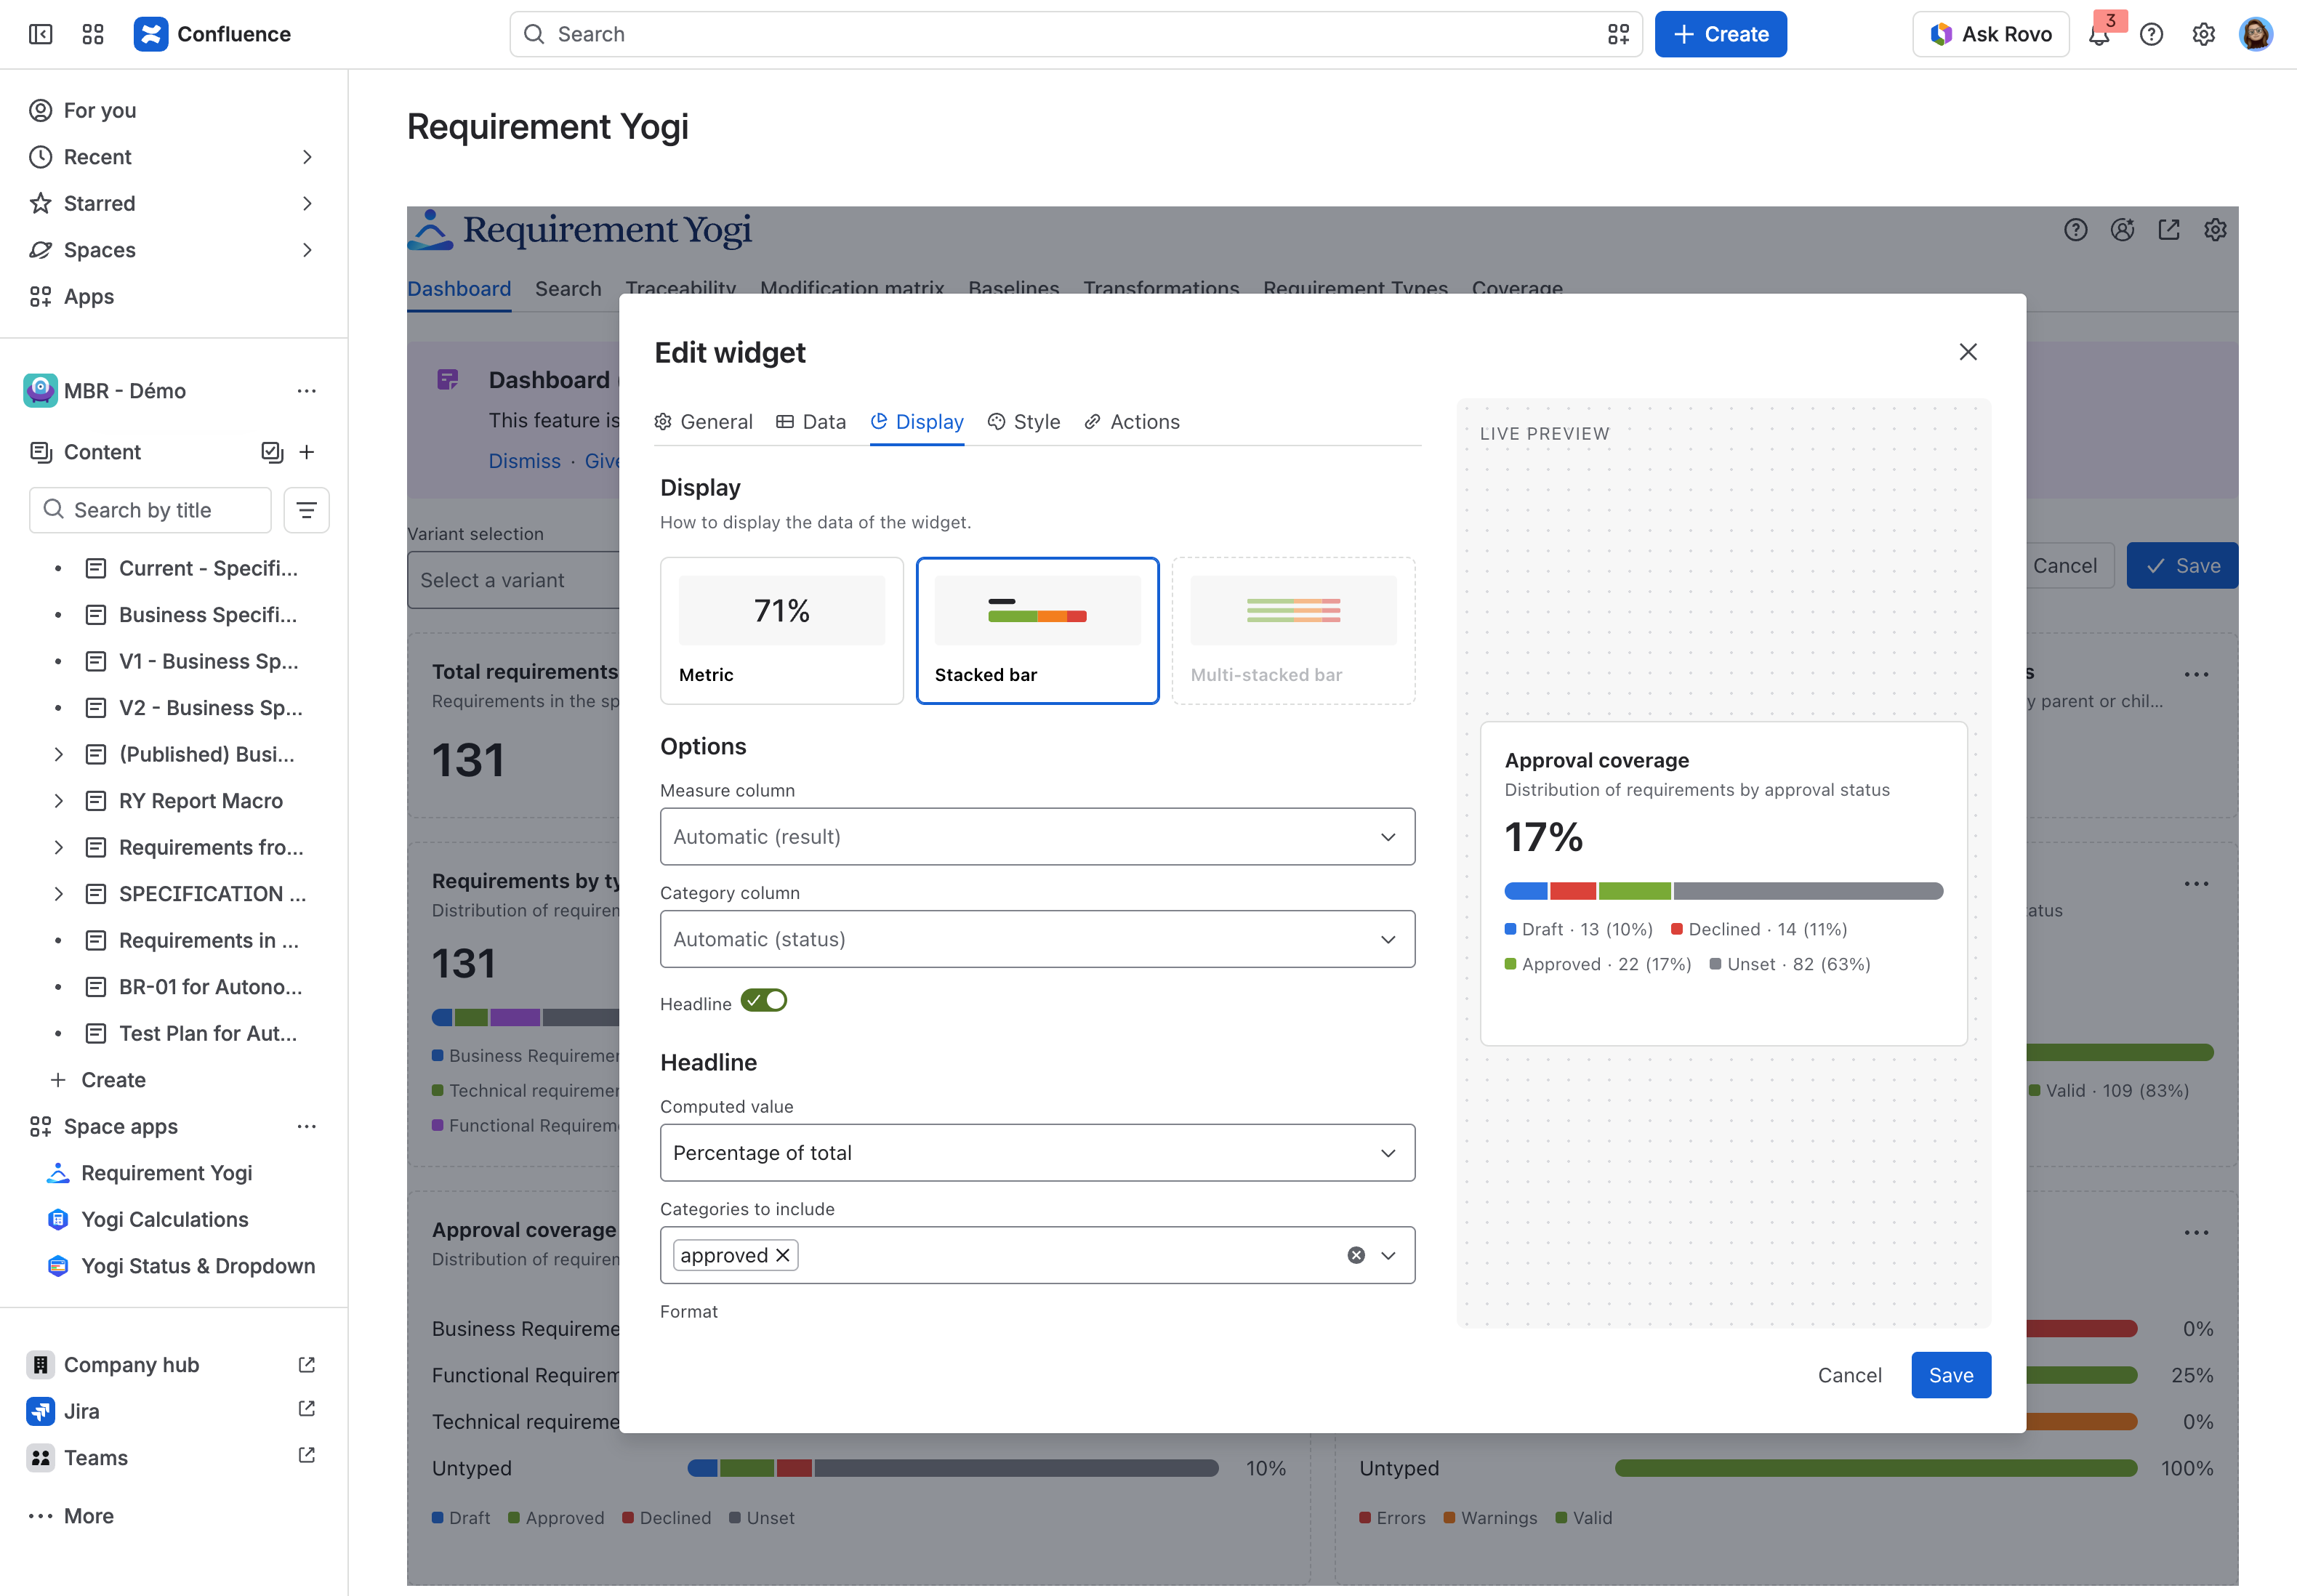
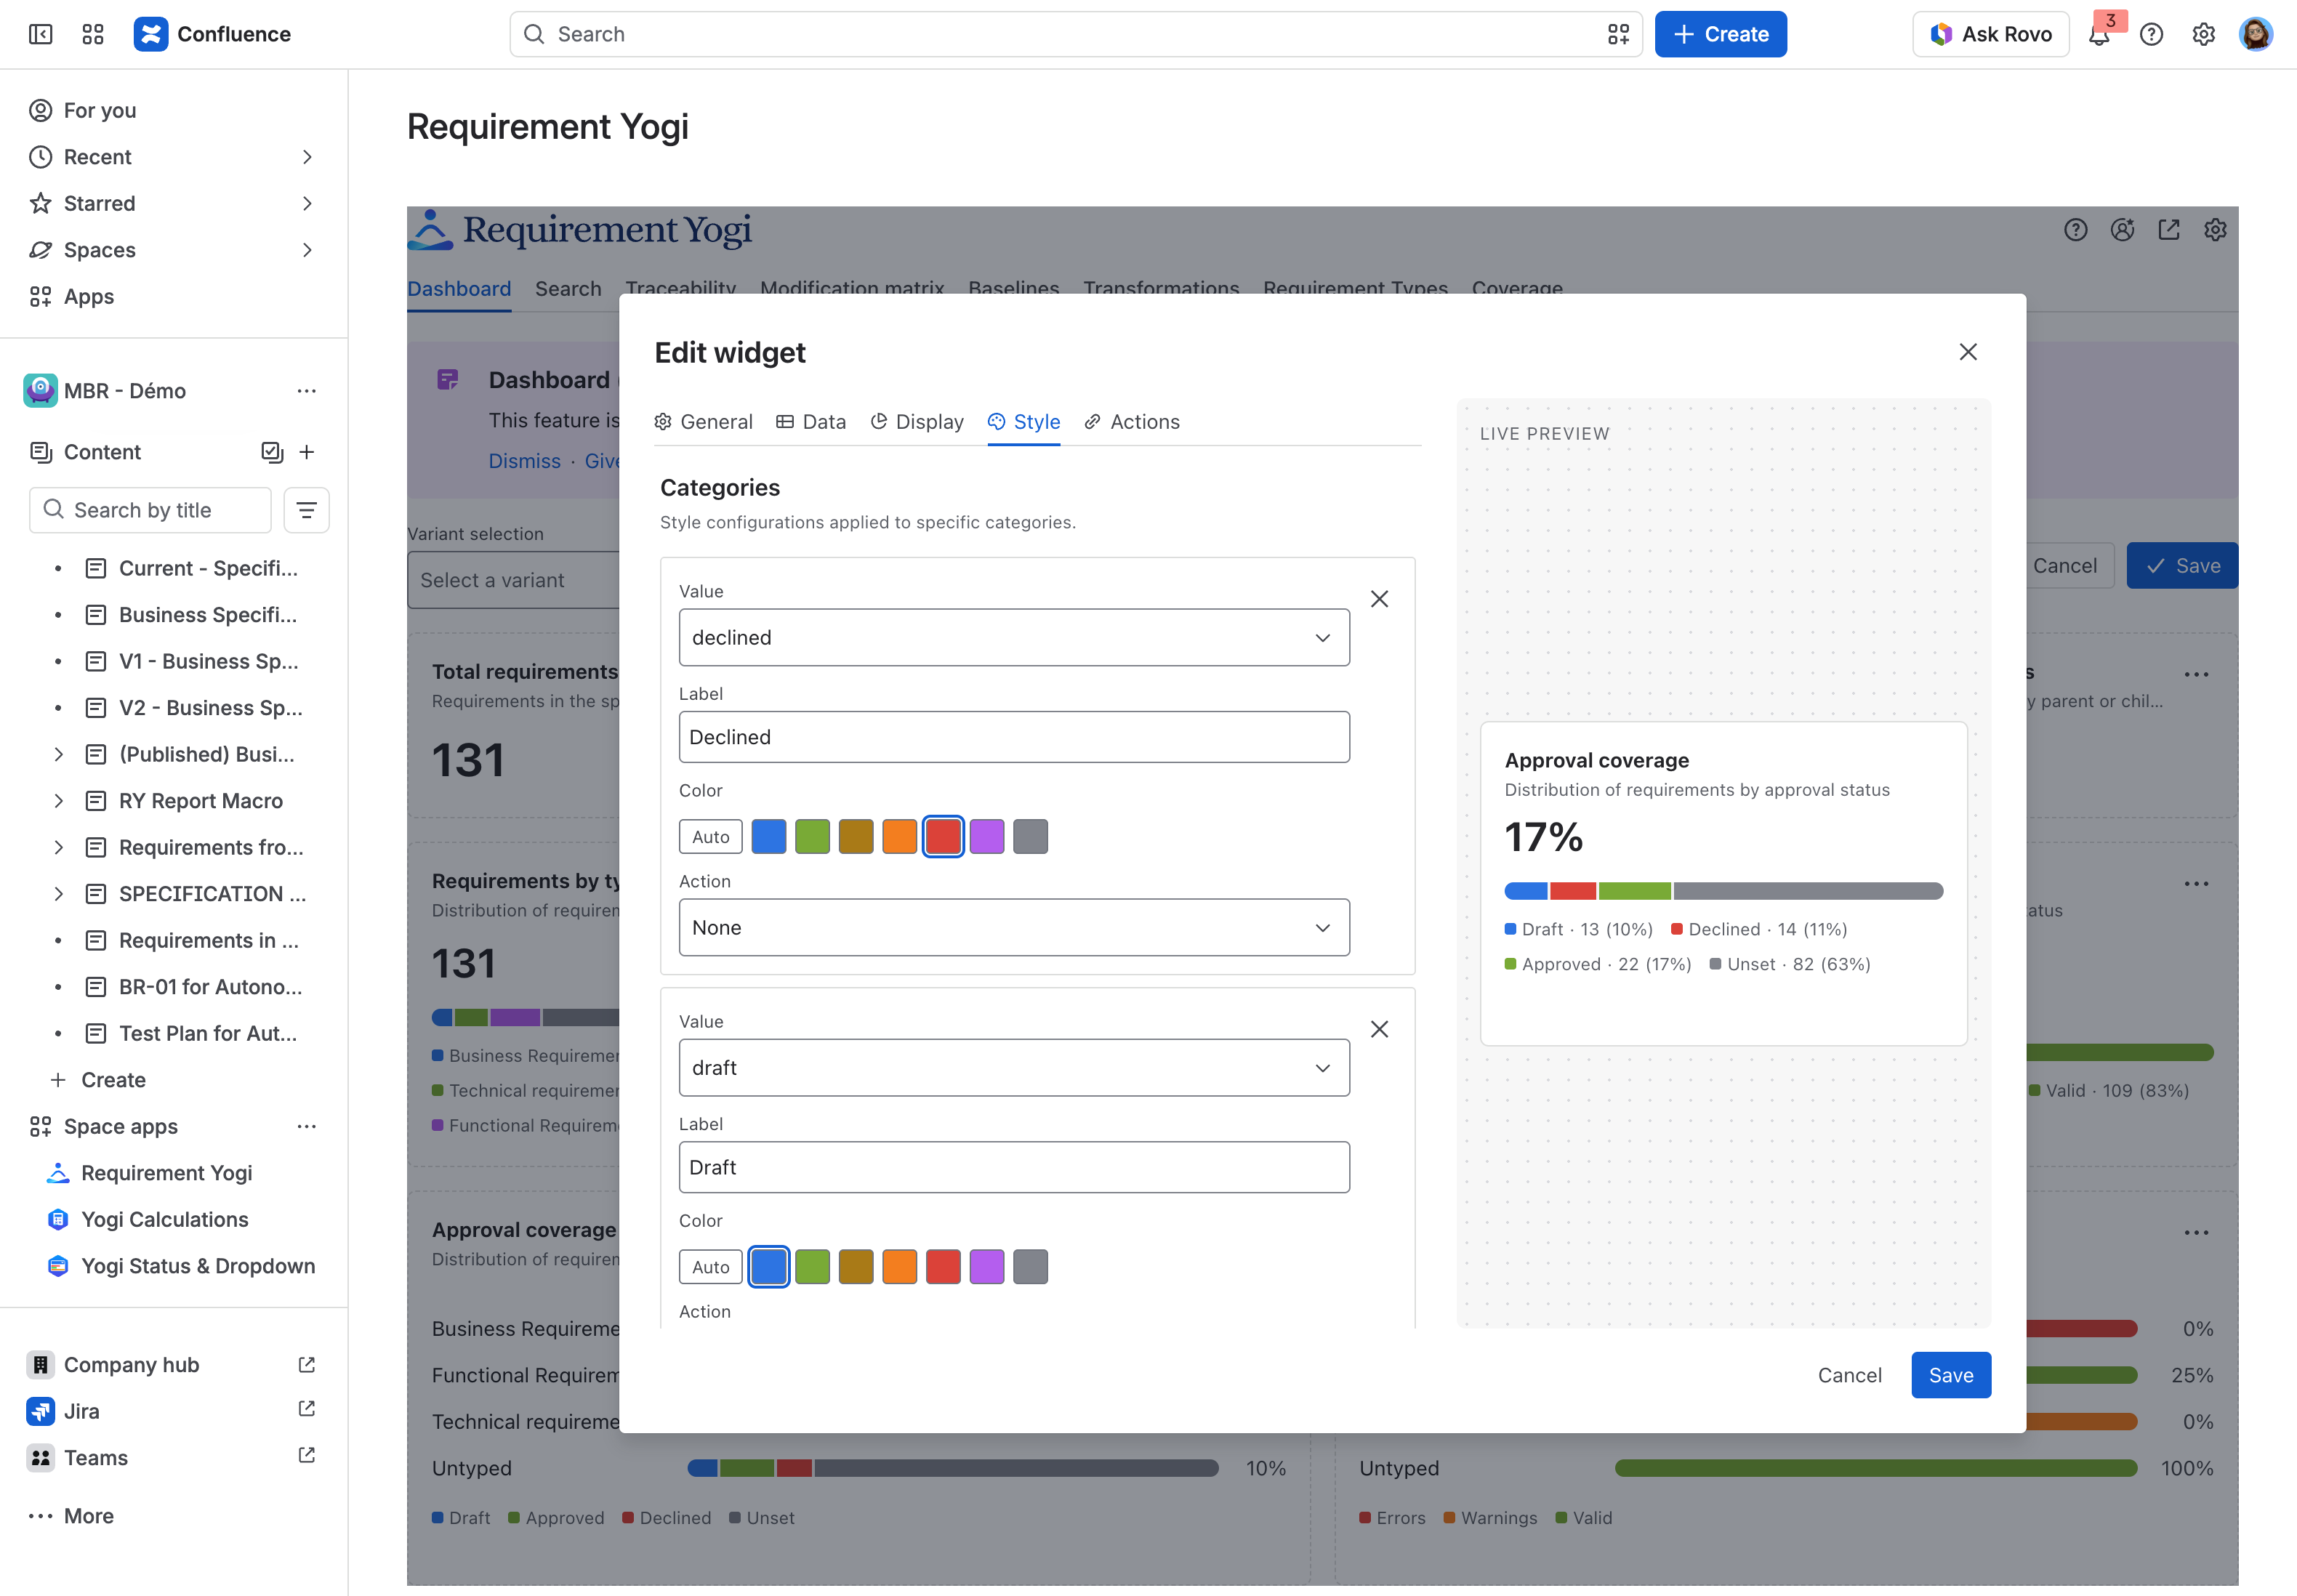
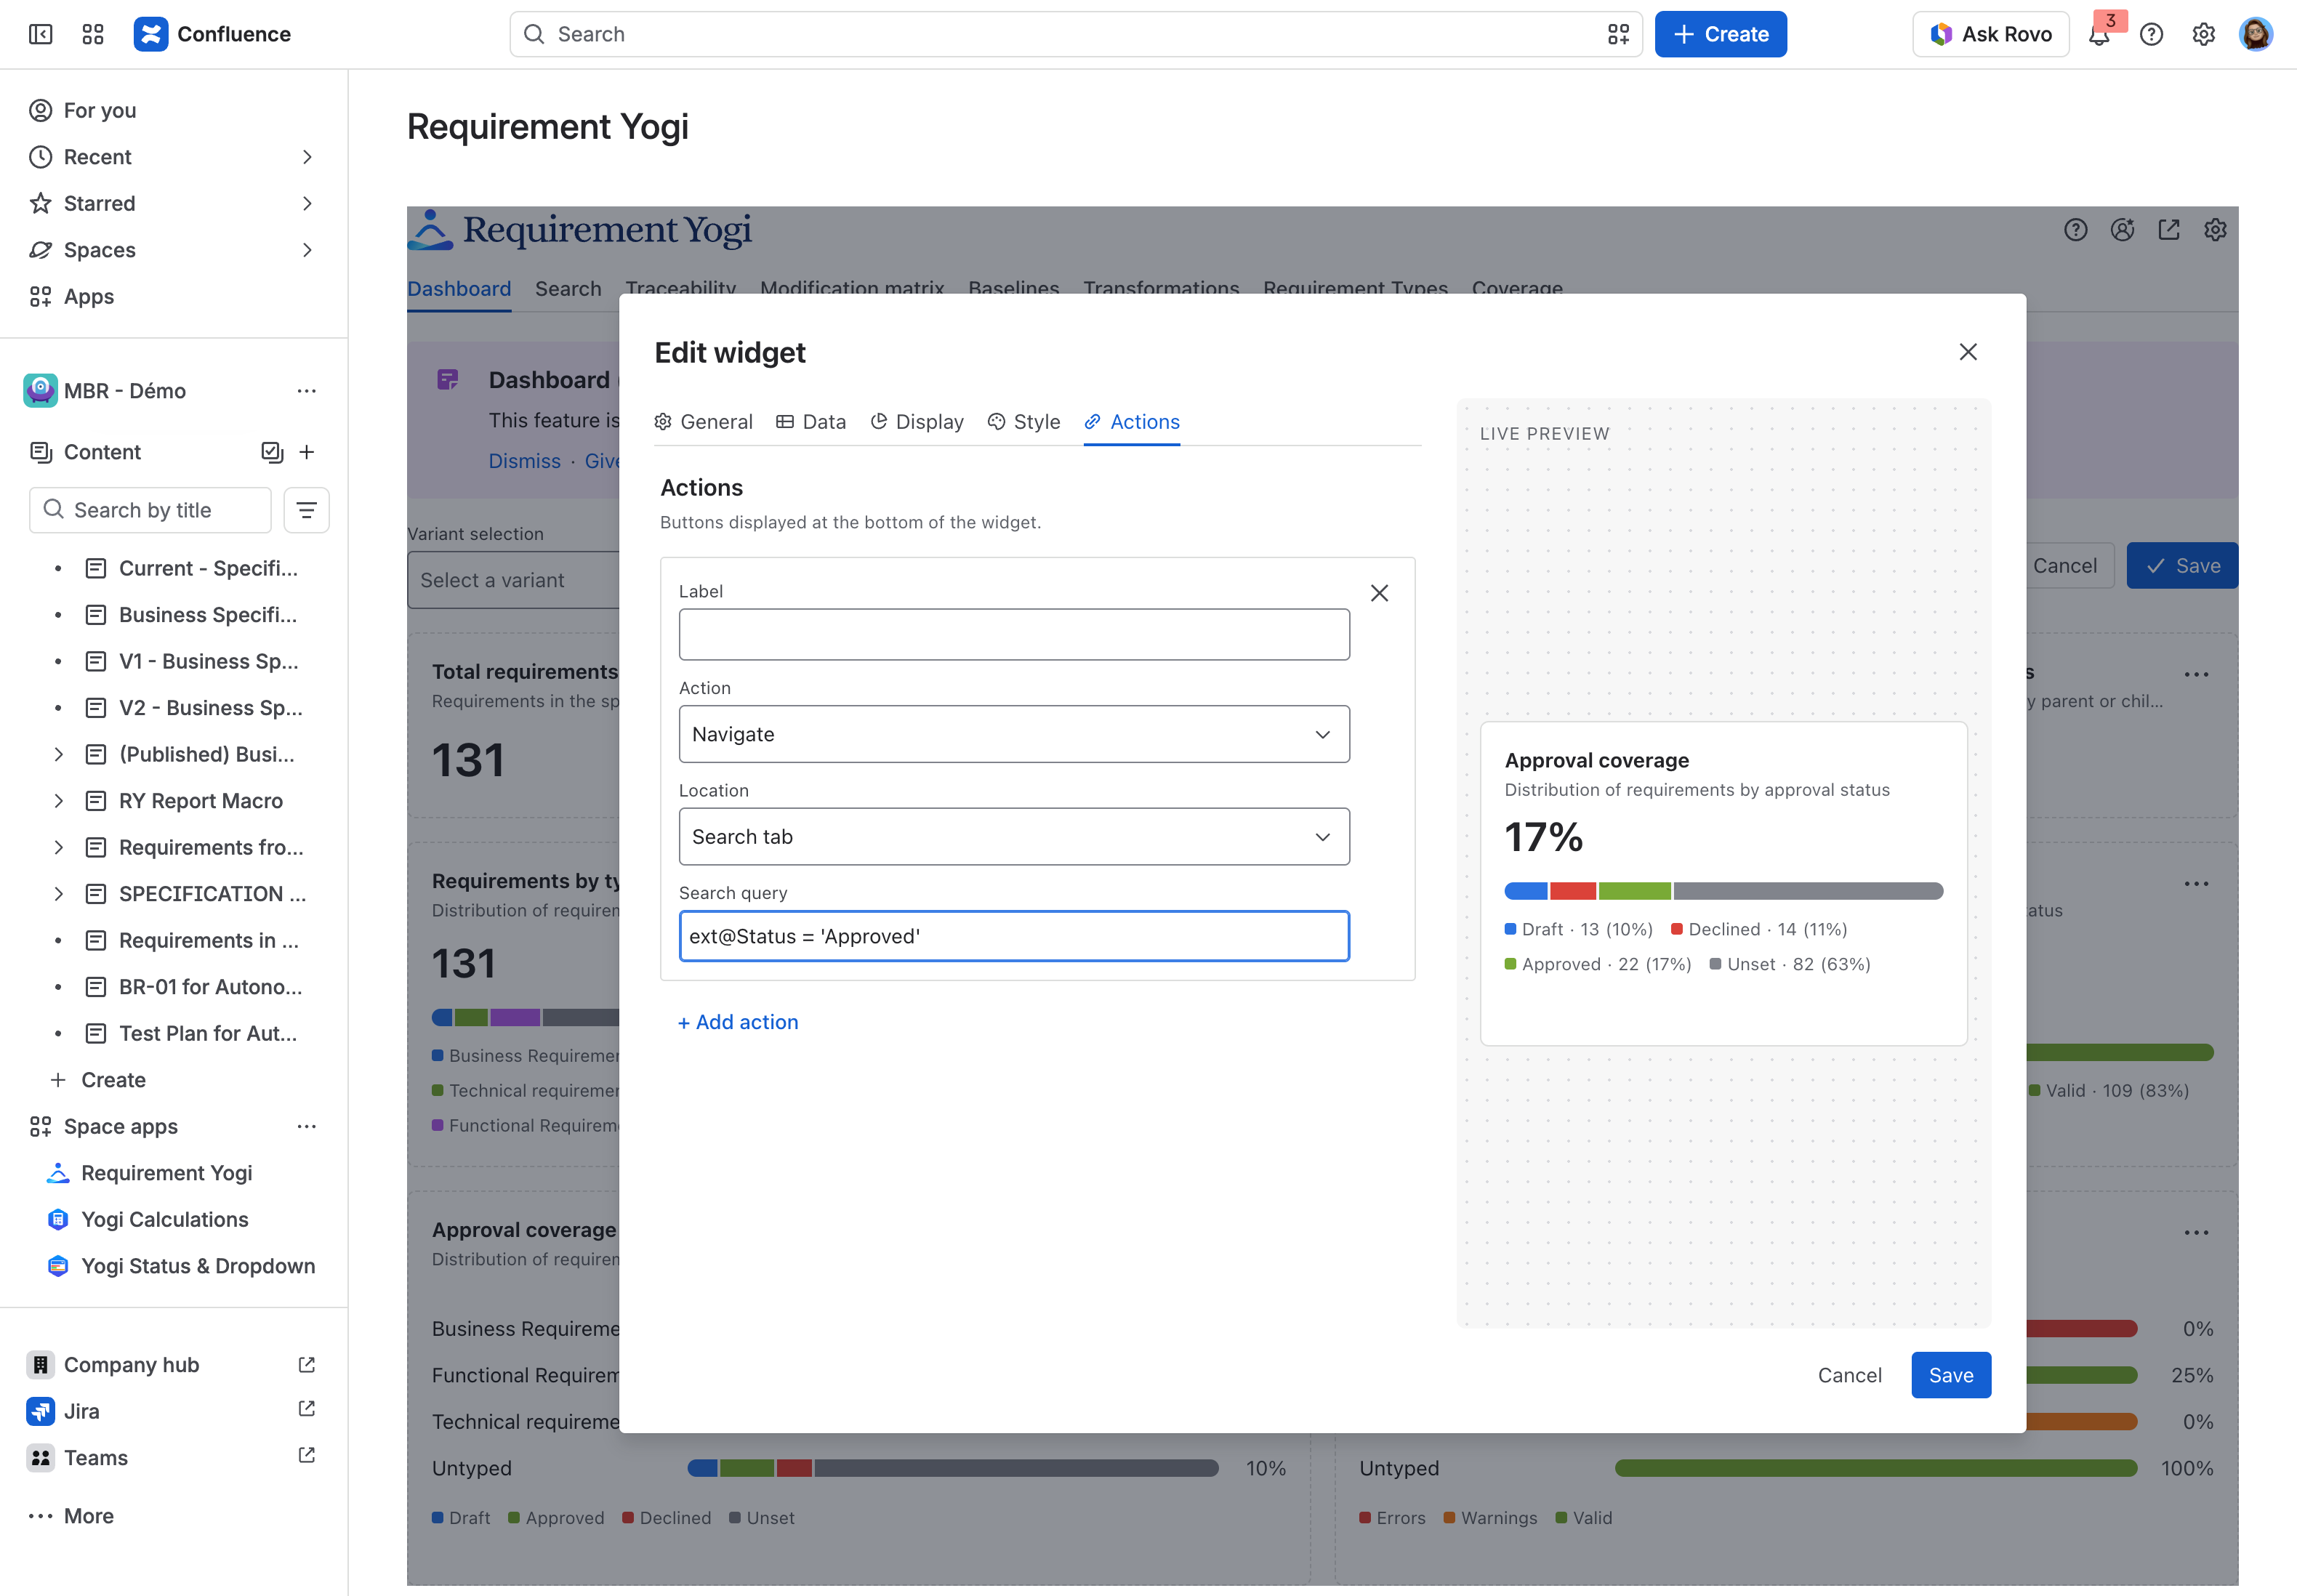
You can click on ‘Edit’ in the top right corner to move widgets. This will also allow you to edit widgets and customize the graphs.
|
|
|
|
|
|
|
|
|
|
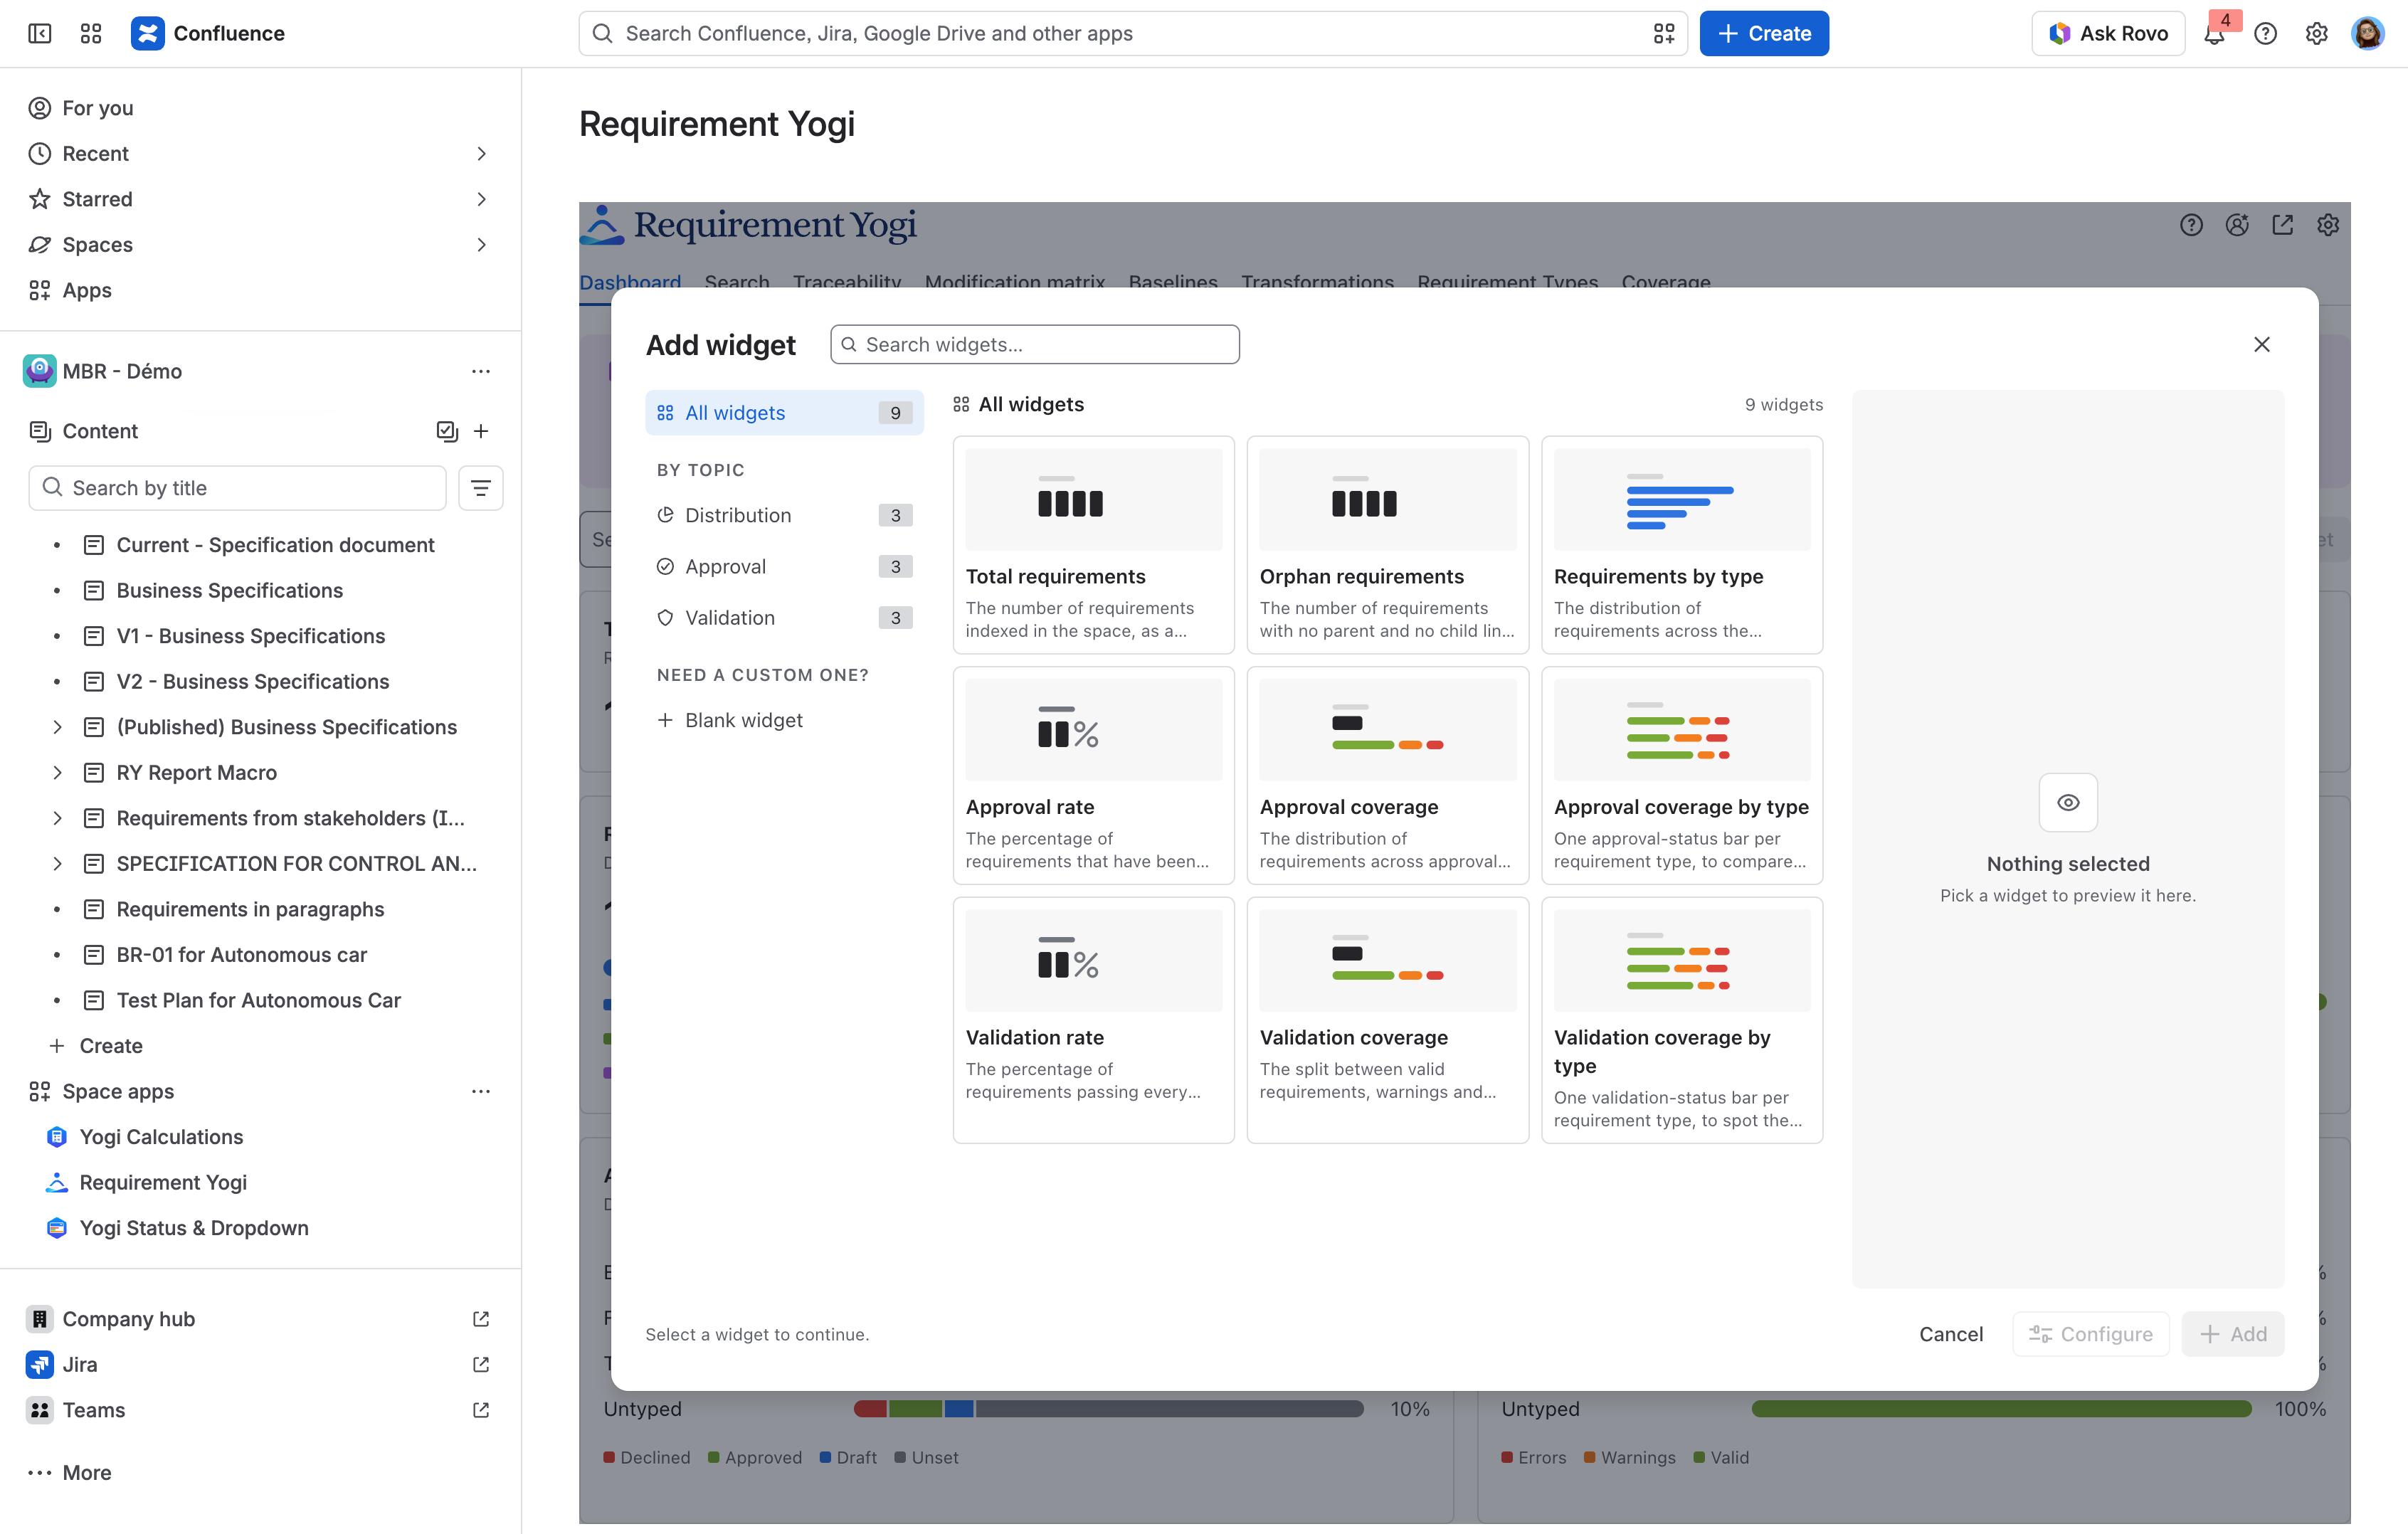
How to add a new widget to the dashboard ?
You can click on ‘+ New Widget’ in the top right corner to add a custom widget. You can also choose custom templates to help you start:
|
|
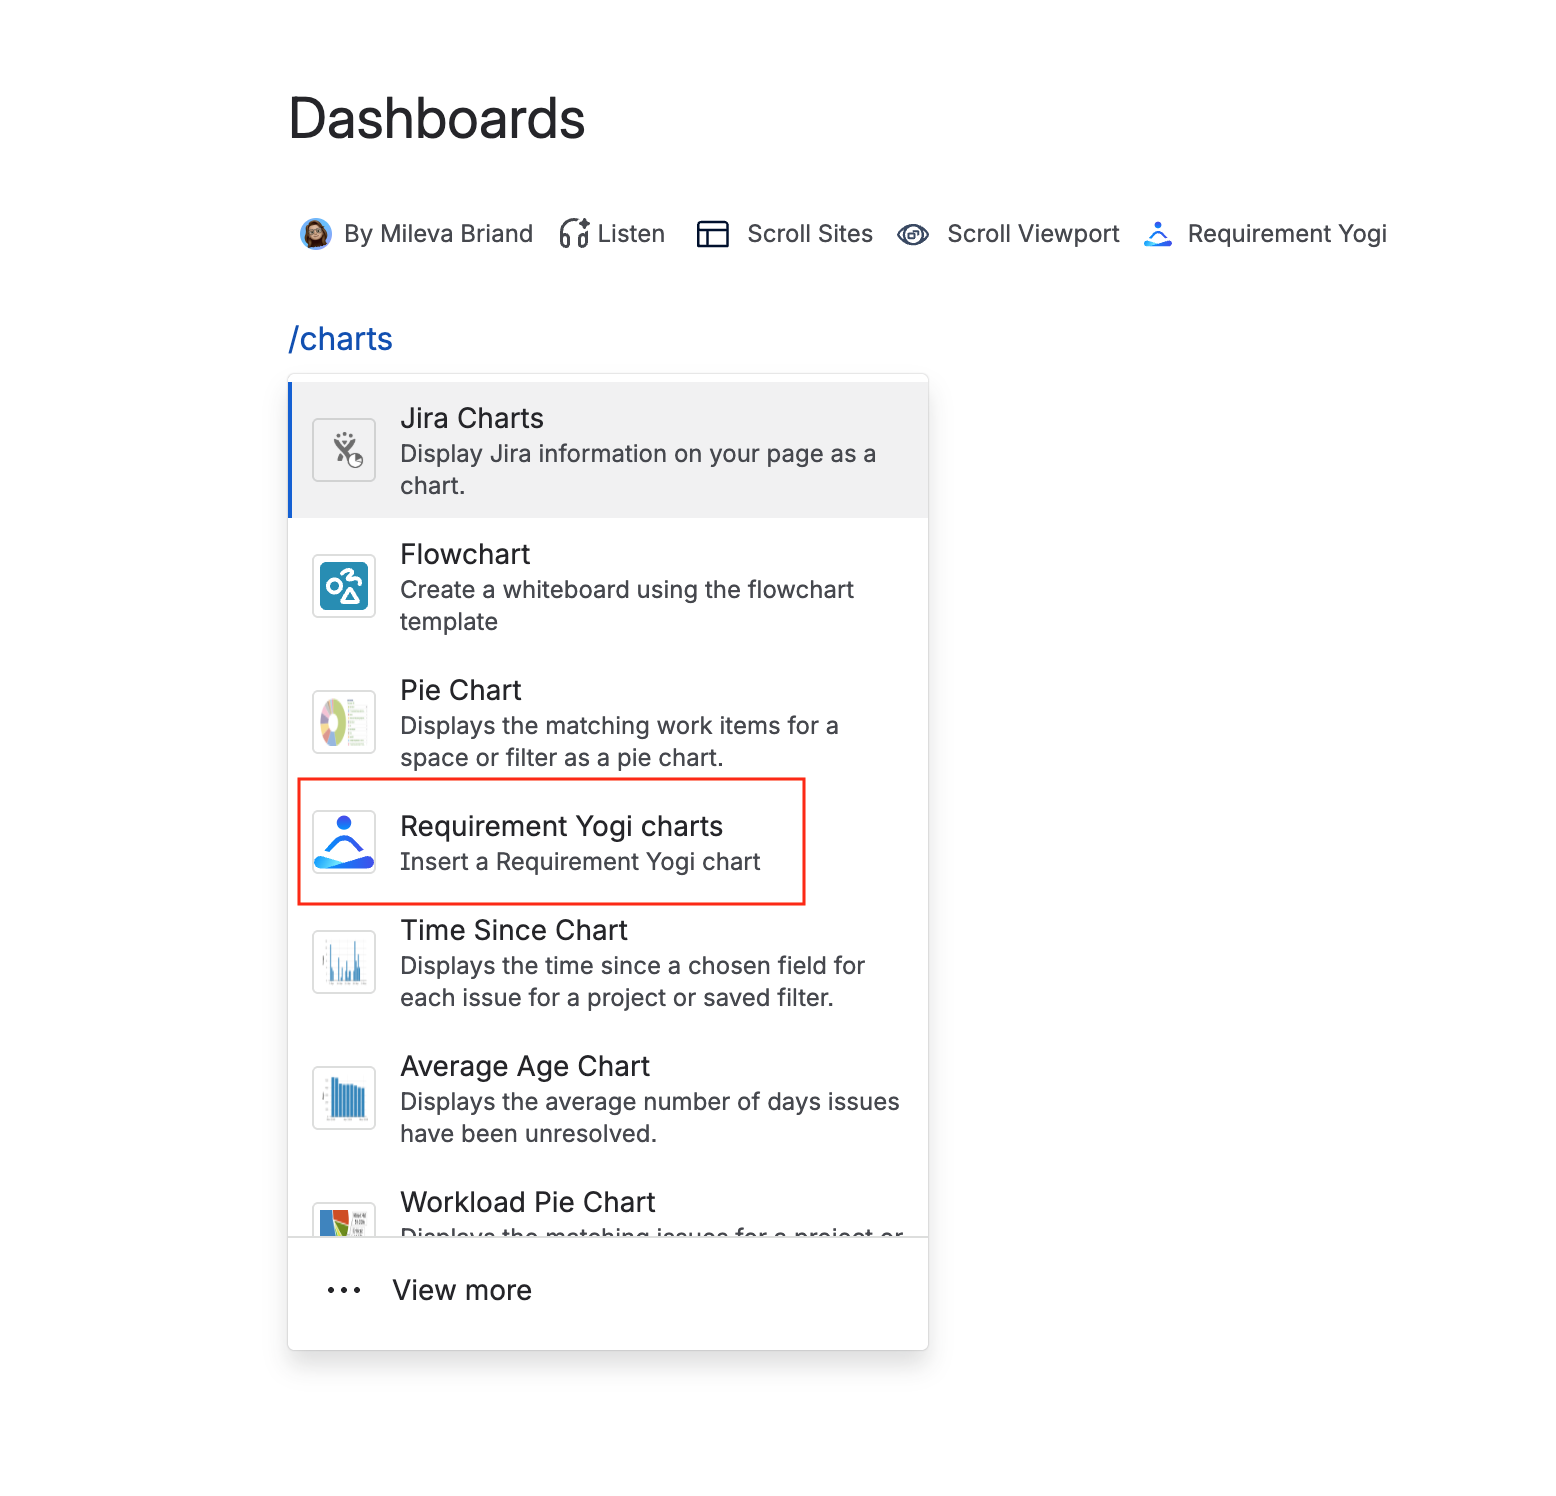
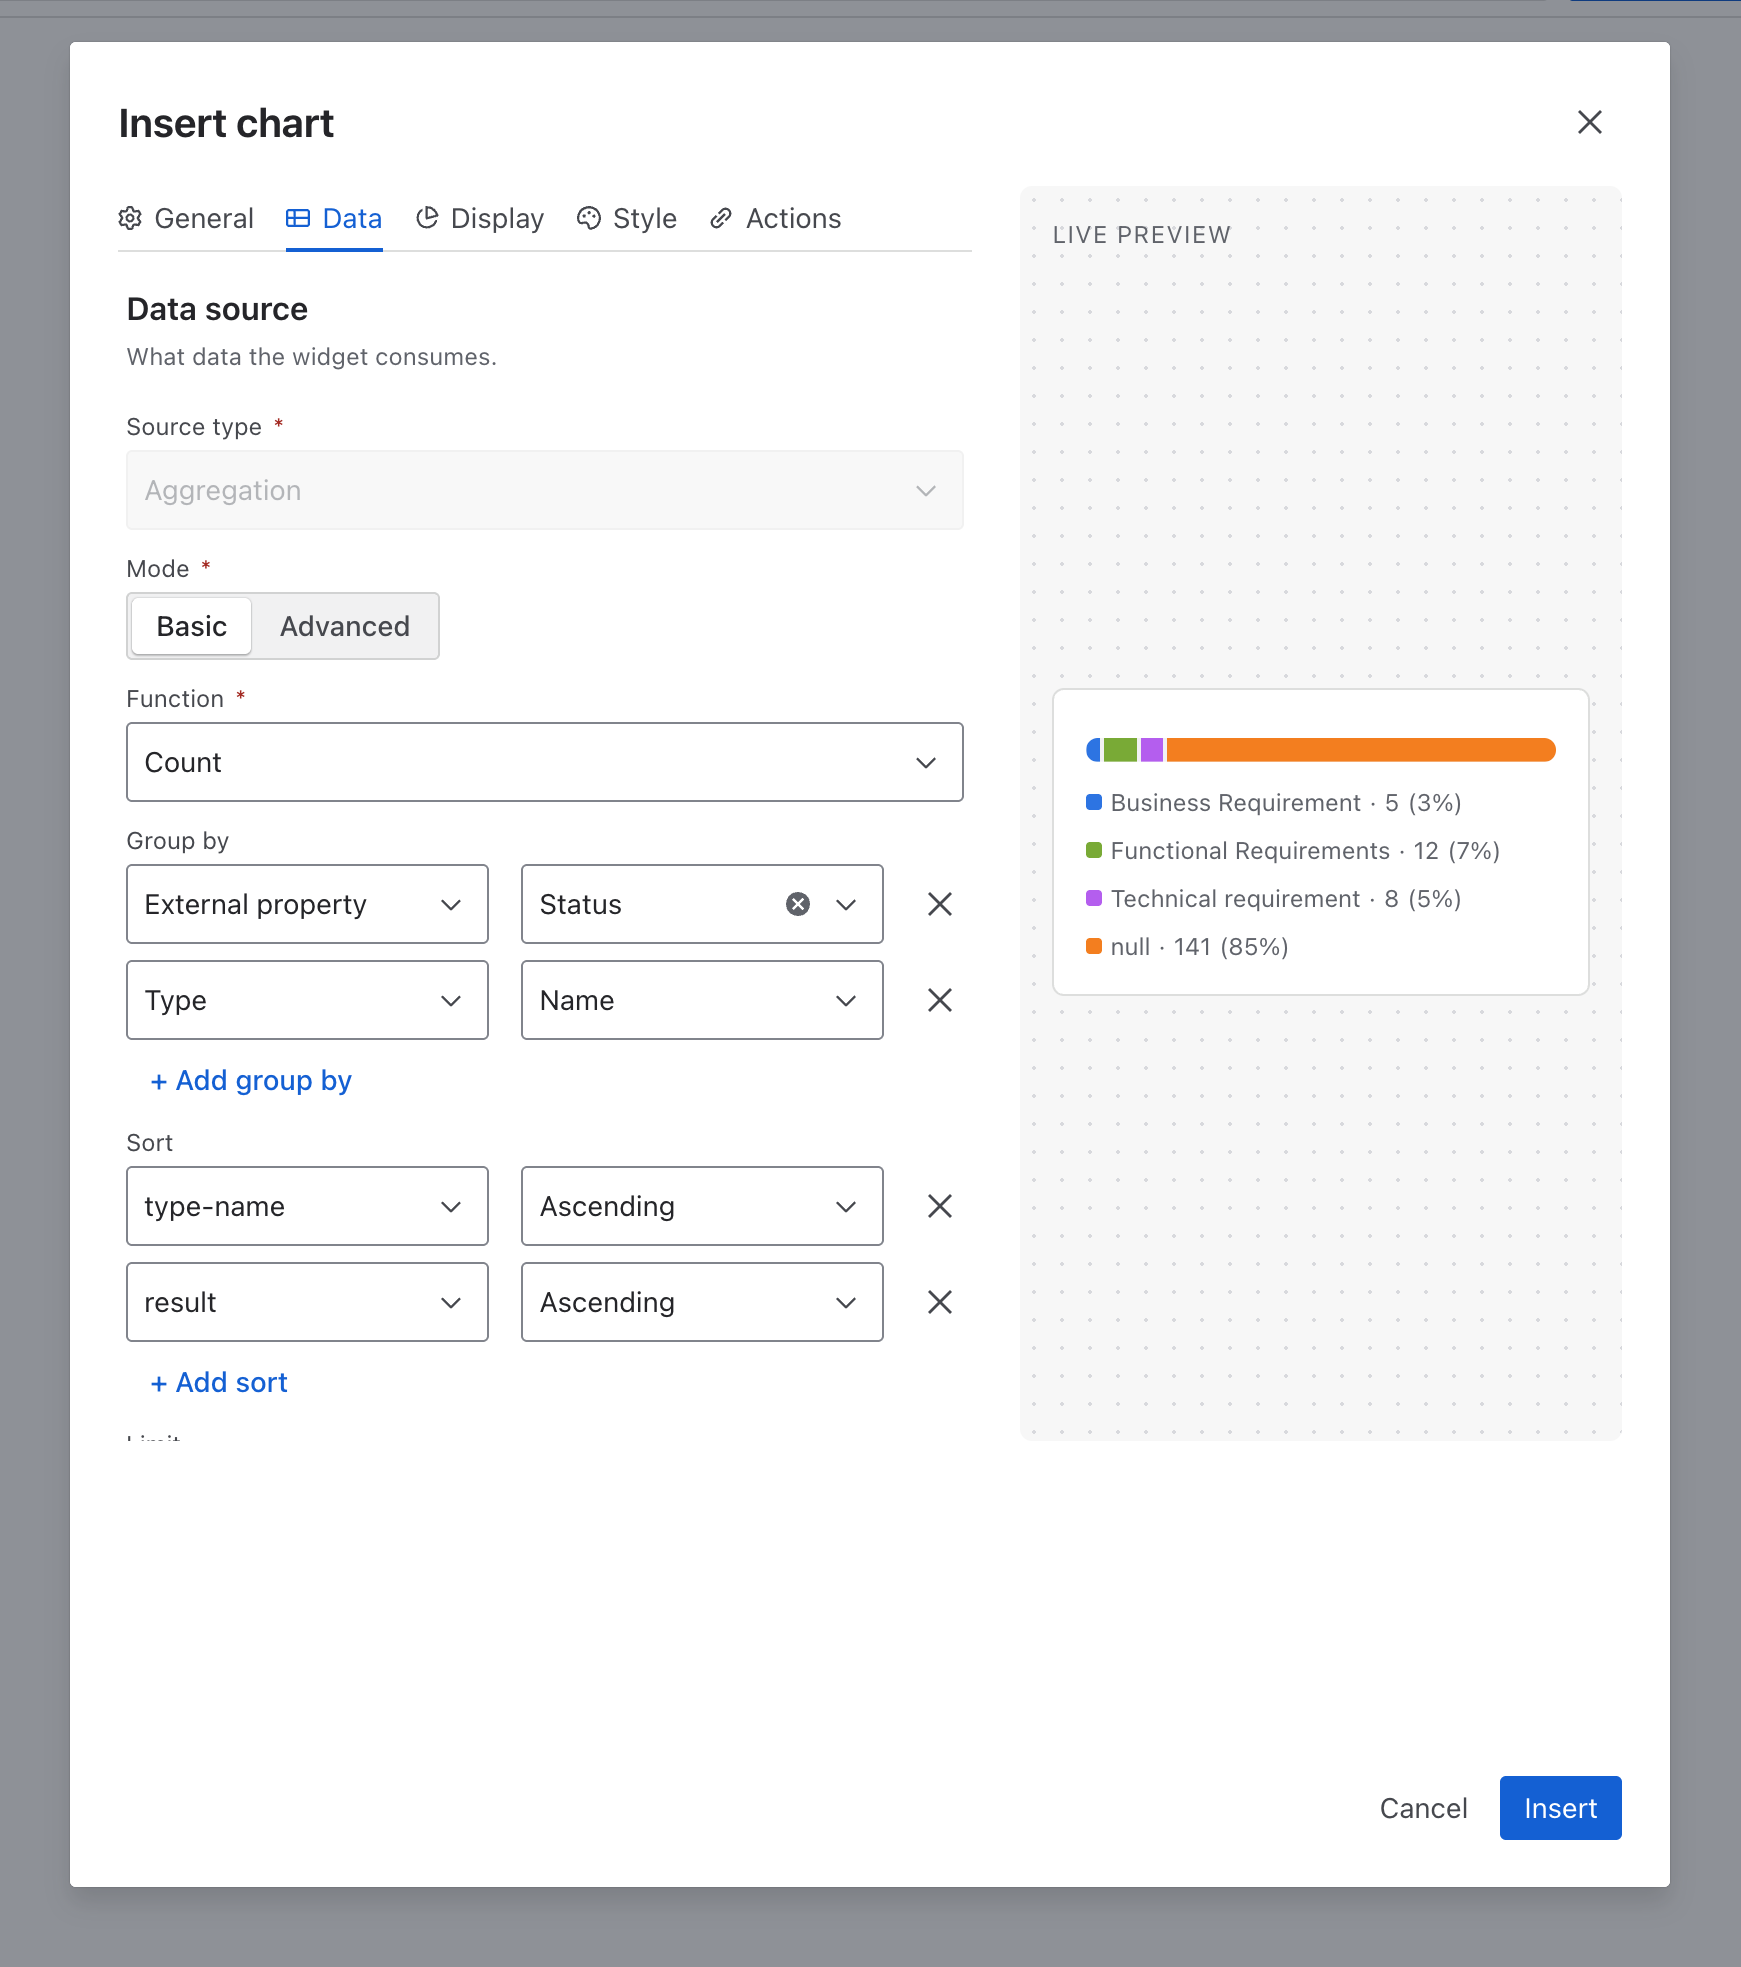
How to embed a dashboard or chart into a page ?
We have created the Requirement Yogi Charts macro, which will allow you to create a chart and embed it in a Confluence page.
|
|
Recommended dashboard widgets
|
Widget |
Purpose |
Example insight |
|---|---|---|
|
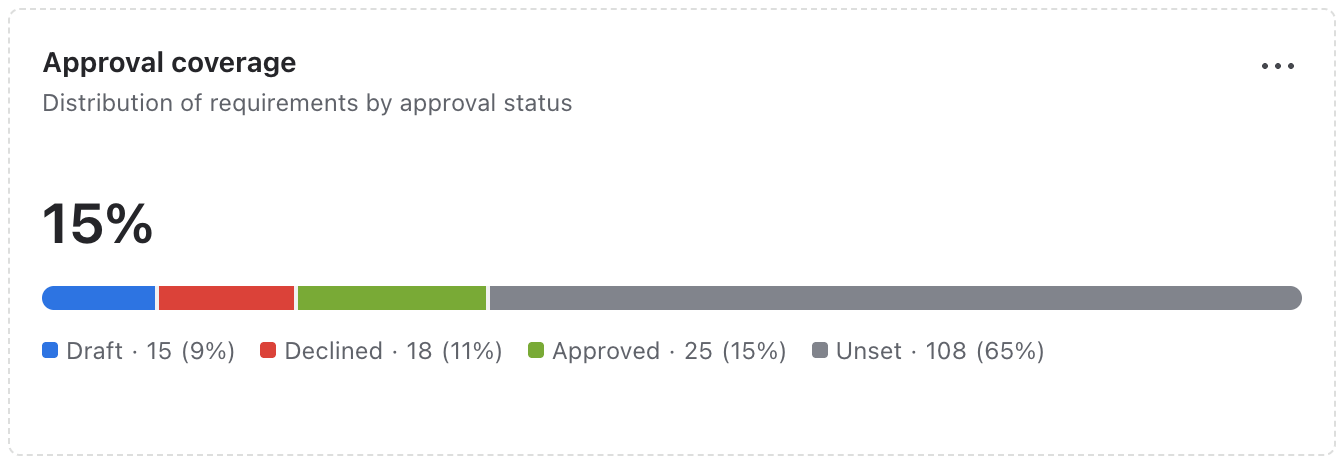
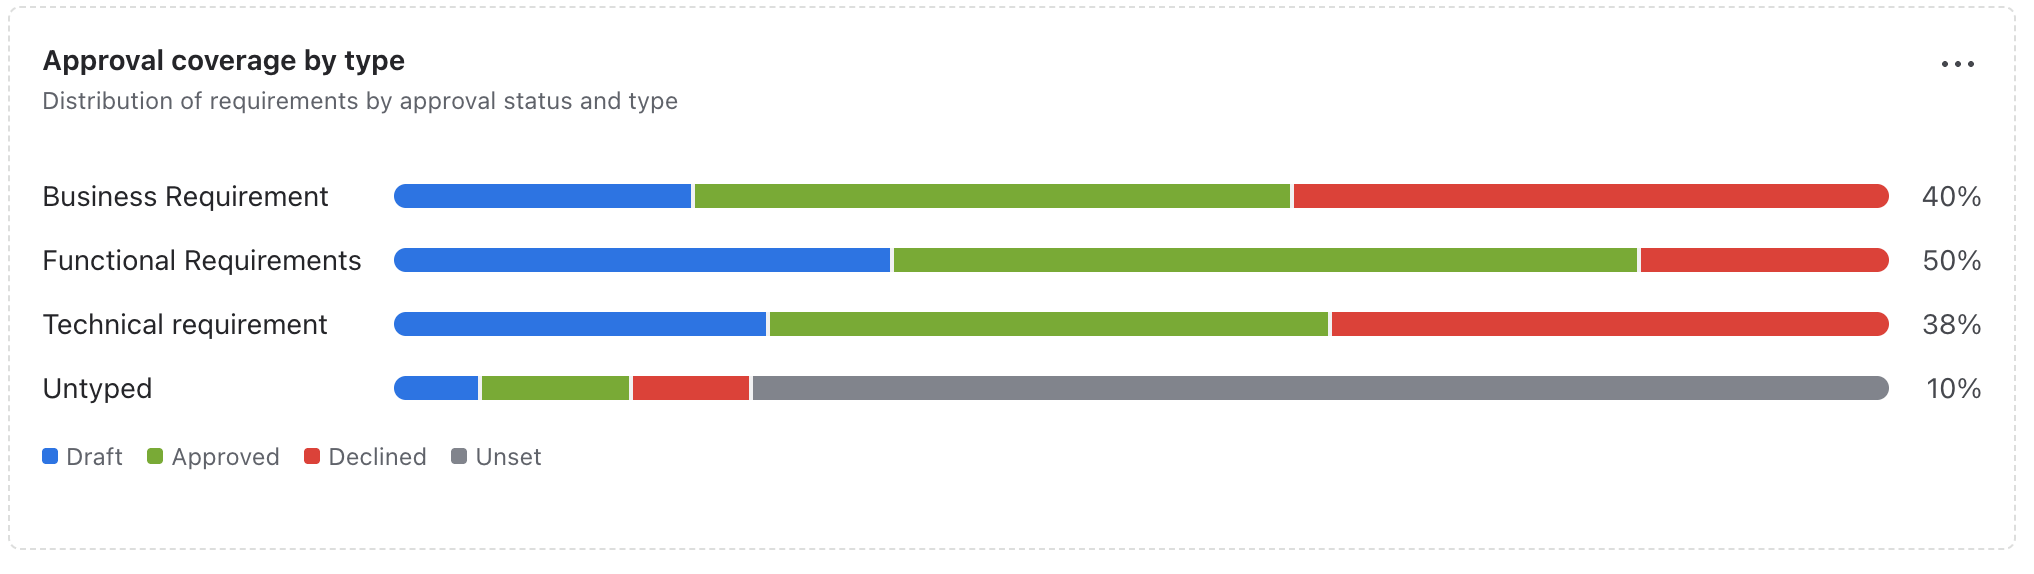
Status coverage |
Shows the status of all requirements defined and how many requirements are approved, in progress, or blocked. You can also group results by requirement type. |
|
|
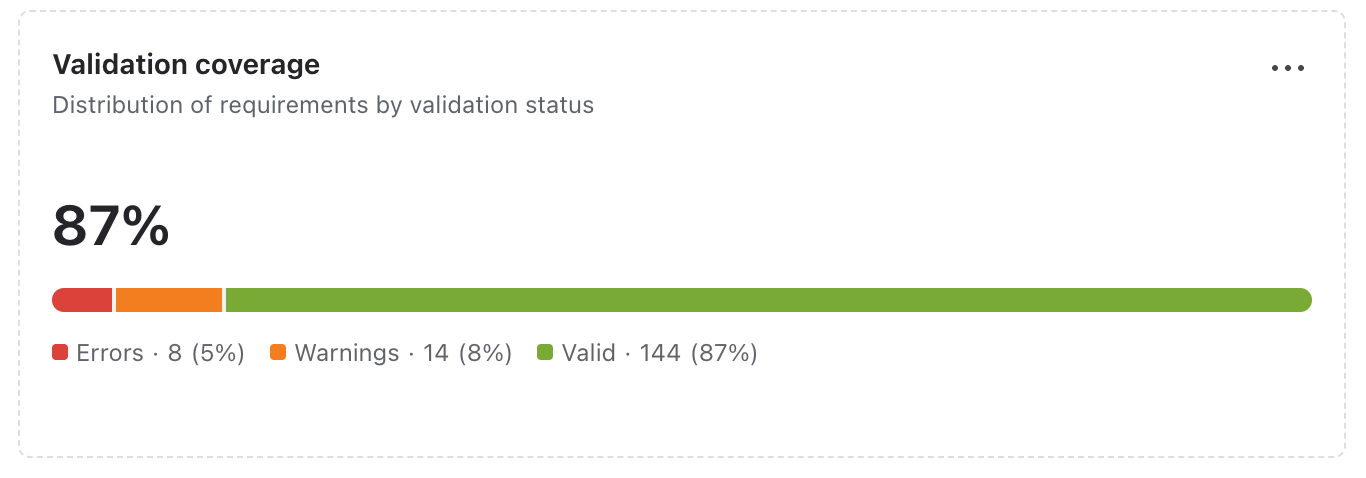
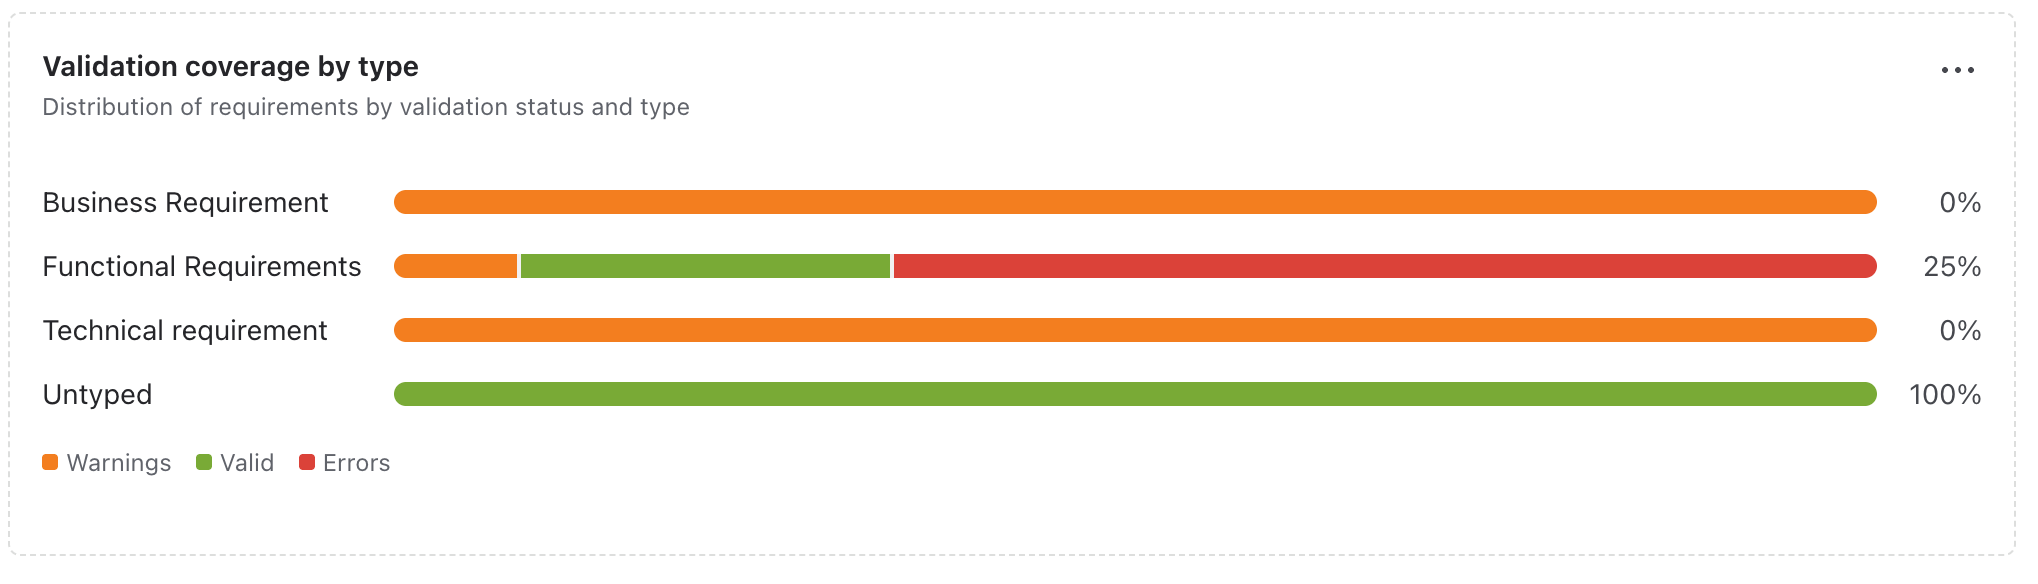
Validation of requirements |
When you use requirement types, show how many requirements are validated, or not compliant. You can group by requirement types. |
|
|
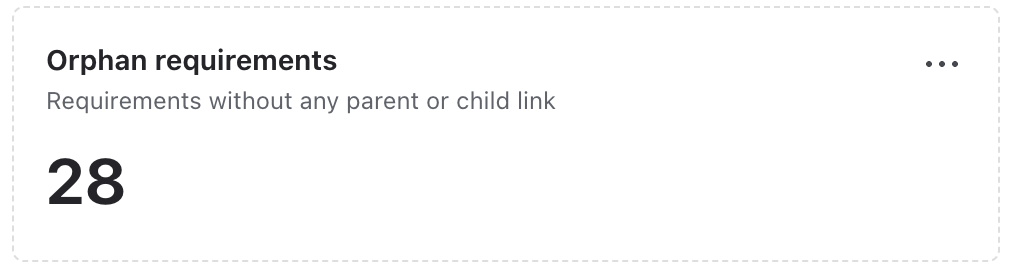
Coverage glance |
Get the number of requirements who are not linked to any other requirements (parent or child) |
|
Best practices
-
Start with a small number of high-value widgets and expand the dashboard over time.
-
Use consistent requirement statuses and labels so charts remain meaningful.
-
Review dashboards regularly to remove outdated filters or obsolete views.
Permissions
-
Space administrators can edit and add new widgets to the Dashboards.
Known beta limitations
-
Some widgets or filters may change before general availability.
-
Large datasets may require more time to load depending on the number of requirements and filters.
-
Export and advanced sharing options may be limited during the beta period.
📢 Feedback
We welcome feedback with open ears. Please share what you are trying to report, which widgets are most useful, and any gaps that prevent you from using dashboards in your workflow. Behaviour, available widgets, and configuration options may evolve based on user feedback.
Reach us here: https://support.requirementyogi.com/ .